Technical Analysis of HDRO 2024-05-10
Overview:
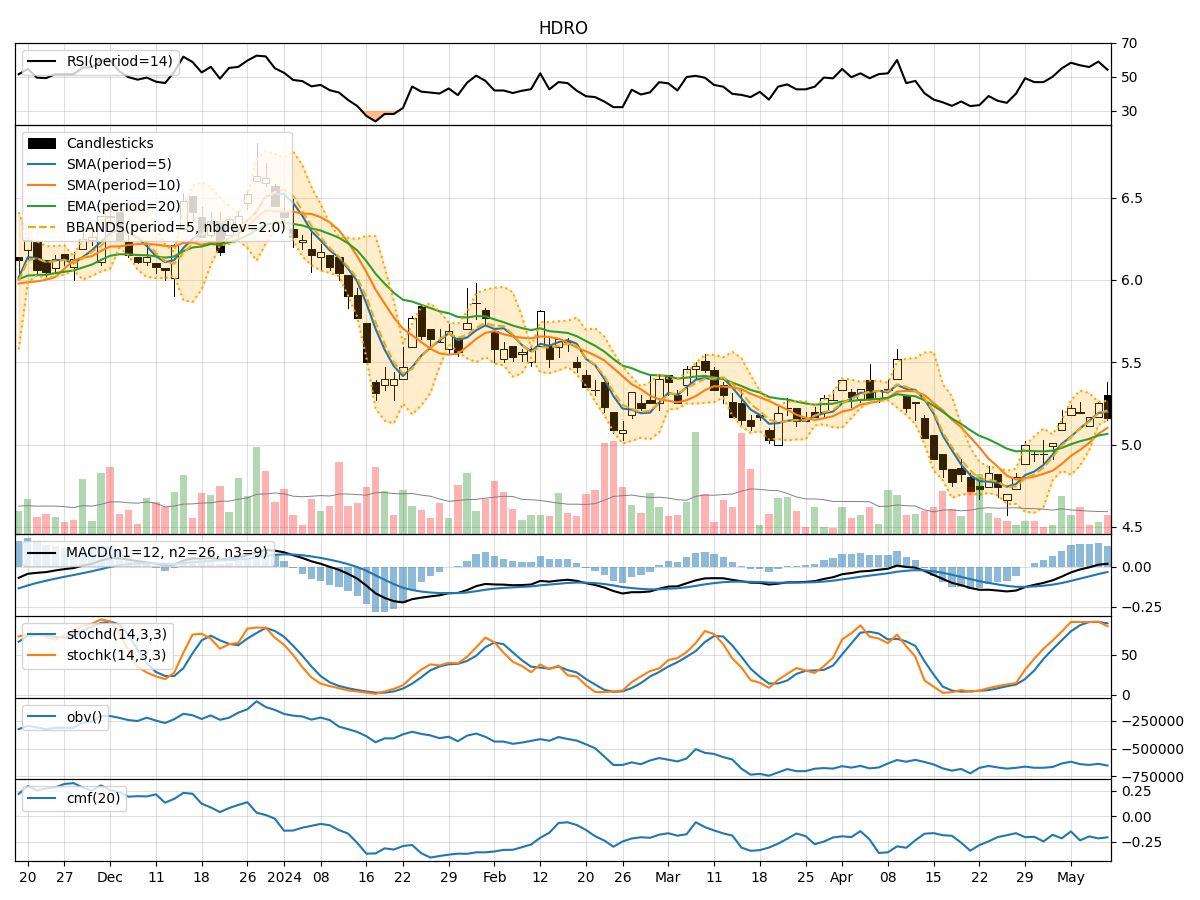
In analyzing the technical indicators for HDRO over the last 5 days, we will delve into the trend, momentum, volatility, and volume indicators to provide a comprehensive outlook on the possible stock price movement in the coming days. By examining these key indicators, we aim to offer valuable insights and recommendations for potential investors.
Trend Analysis:
- Moving Averages (MA): The 5-day Moving Average (MA) has been consistently above the Simple Moving Average (SMA) and Exponential Moving Average (EMA) over the past 5 days, indicating a bullish trend.
- MACD: The MACD line has been positive, with the MACD Histogram showing an increasing trend, suggesting bullish momentum in the stock price.
Momentum Analysis:
- RSI: The Relative Strength Index (RSI) has been fluctuating around the 50 level, indicating a neutral momentum in the stock.
- Stochastic Oscillator: Both %K and %D have been relatively high, suggesting that the stock may be overbought in the short term.
Volatility Analysis:
- Bollinger Bands (BB): The stock price has been trading within the Bollinger Bands, with the bands narrowing over the past few days, indicating decreasing volatility.
- Bollinger %B: The %B indicator has been hovering around the middle range, signifying a neutral stance in terms of volatility.
Volume Analysis:
- On-Balance Volume (OBV): The OBV has shown a slight decline over the last 5 days, indicating a decrease in buying pressure.
- Chaikin Money Flow (CMF): The CMF has been negative, suggesting that money may be flowing out of the stock.
Conclusion:
Based on the analysis of the technical indicators, the stock of HDRO is currently exhibiting a bullish trend, supported by positive MACD and moving averages. However, the momentum indicators like RSI and Stochastic Oscillator suggest a neutral stance, indicating a possible consolidation phase in the near term. The volatility is decreasing, as shown by the narrowing Bollinger Bands, while the volume indicators point towards a slight decrease in buying pressure.
Recommendation:
Considering the overall technical analysis, it is likely that HDRO may experience some consolidation in the coming days, with a potential for a sideways movement in the stock price. Investors should closely monitor the key support and resistance levels, as well as any significant news or market developments that could impact the stock's performance. It is advisable to wait for further confirmation from the technical indicators before making any significant trading decisions.