Technical Analysis of HEDJ 2024-05-10
Overview:
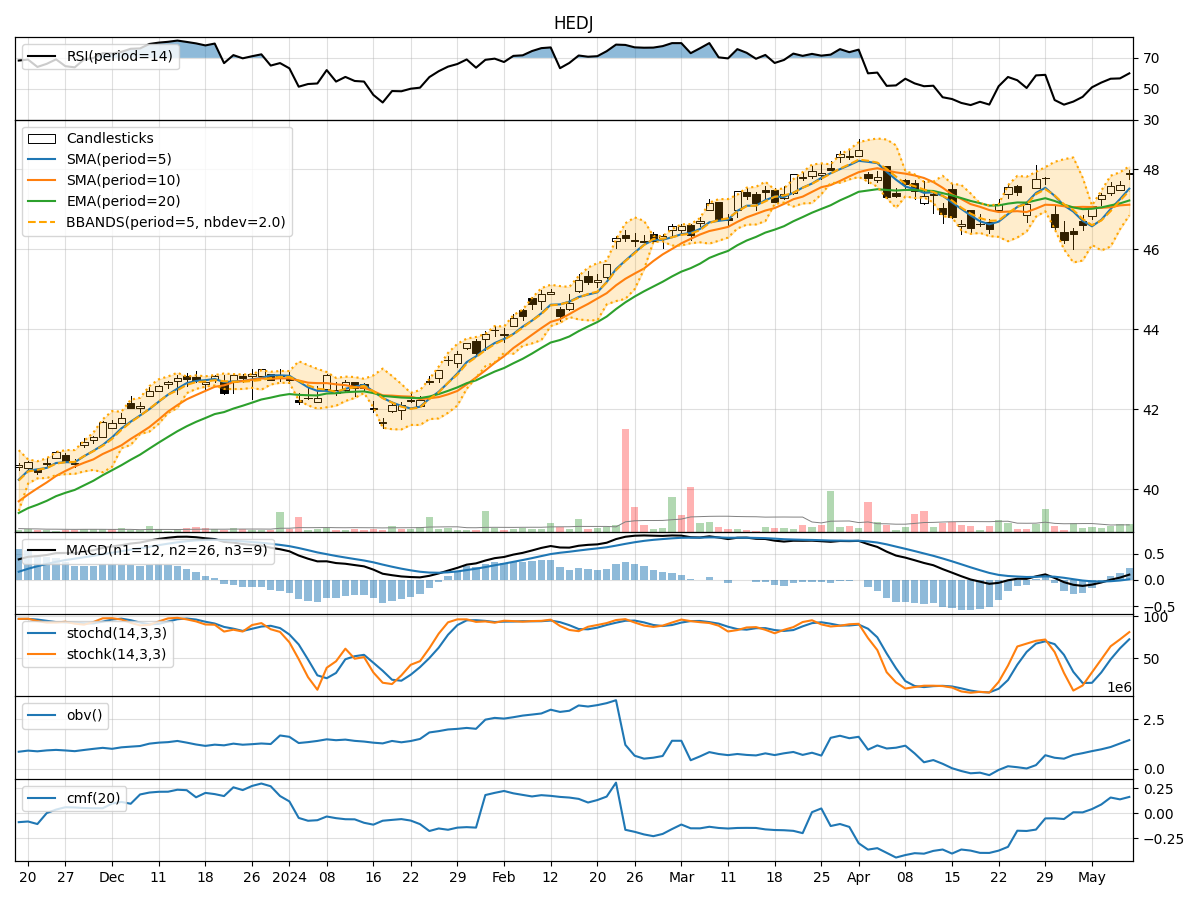
In analyzing the technical indicators for HEDJ over the last 5 days, we will delve into the trend, momentum, volatility, and volume indicators to provide a comprehensive outlook on the possible stock price movement in the coming days. By examining these key indicators, we aim to offer valuable insights and predictions for informed decision-making.
Trend Analysis:
- Moving Averages (MA): The 5-day Moving Average (MA) has been consistently rising, indicating a bullish trend in the short term.
- MACD: The MACD line has been trending upwards, crossing above the signal line, suggesting a potential bullish momentum.
- EMA: The Exponential Moving Average (EMA) has been steadily increasing, supporting the bullish trend.
Key Observation: The trend indicators point towards a bullish outlook for HEDJ in the near future.
Momentum Analysis:
- RSI: The Relative Strength Index (RSI) has been increasing, indicating strengthening buying momentum.
- Stochastic Oscillator: Both %K and %D have been rising, signaling increasing buying pressure.
- Williams %R: The indicator has been moving towards oversold territory, suggesting a potential buying opportunity.
Key Observation: Momentum indicators suggest a bullish momentum for HEDJ in the upcoming days.
Volatility Analysis:
- Bollinger Bands (BB): The bands have been widening, indicating increased volatility in the stock price.
Key Observation: Volatility is on the rise, which may lead to larger price swings in the near term.
Volume Analysis:
- On-Balance Volume (OBV): The OBV has been showing a decreasing trend, indicating a potential divergence between price and volume.
- Chaikin Money Flow (CMF): The CMF has been positive, suggesting buying pressure in the market.
Key Observation: Volume indicators show mixed signals, with OBV diverging from price movement but CMF indicating buying pressure.
Conclusion:
Based on the analysis of trend, momentum, volatility, and volume indicators, the overall outlook for HEDJ in the next few days is bullish. The trend is positive, momentum is strong, and volatility is increasing, which could lead to potential price gains. However, the divergence in volume indicators warrants caution, as it may indicate a lack of confirmation in the price movement. Traders and investors should closely monitor the price action and volume dynamics to validate the bullish bias and consider risk management strategies.