Technical Analysis of HELX 2024-05-10
Overview:
In analyzing the technical indicators for HELX over the last 5 days, we will delve into the trend, momentum, volatility, and volume indicators to provide a comprehensive outlook on the possible stock price movement in the coming days.
Trend Analysis:
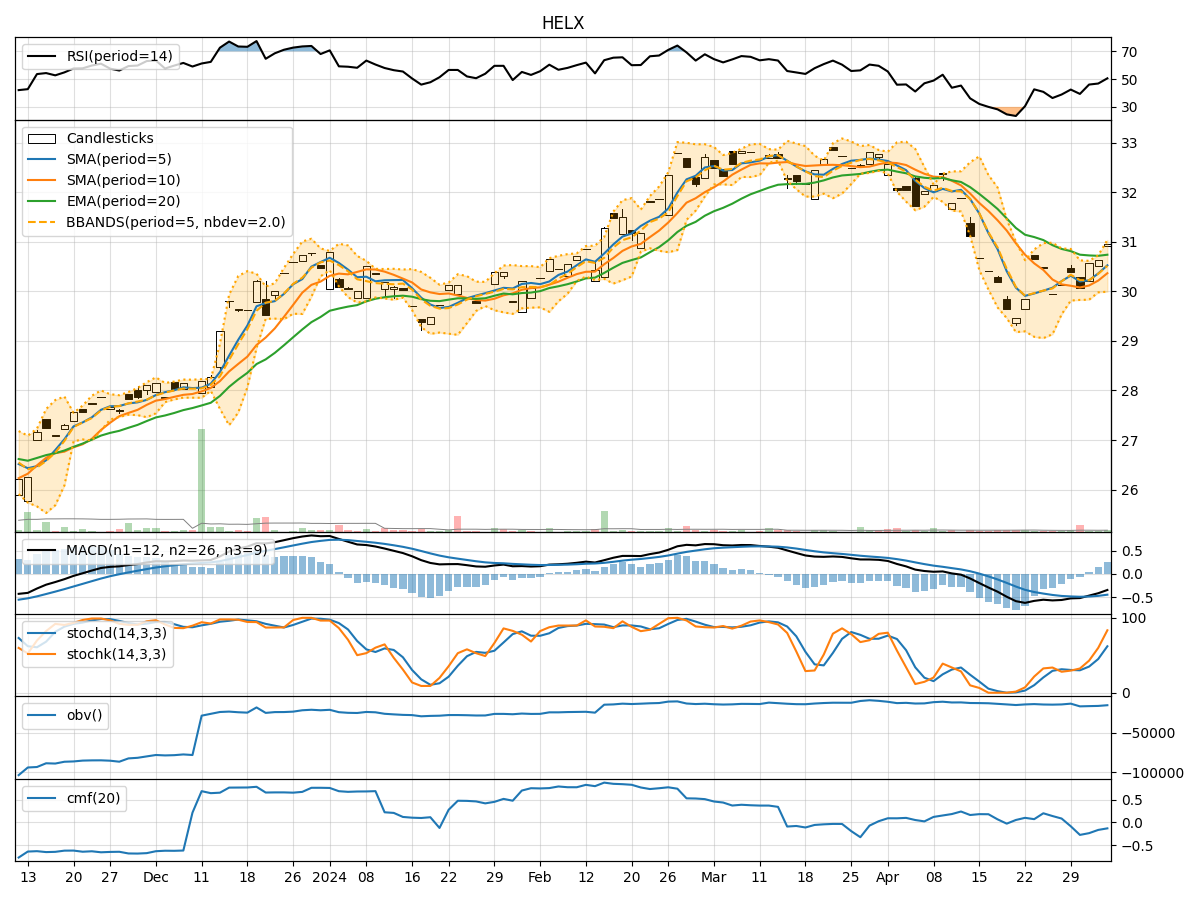
- Moving Averages (MA): The 5-day Moving Average (MA) has been consistently above the Simple Moving Average (SMA) and Exponential Moving Average (EMA), indicating a bullish trend.
- MACD: The MACD line has been negative but showing signs of convergence towards the signal line, suggesting a potential bullish crossover.
- MACD Histogram: The MACD Histogram has been gradually decreasing, but the recent values are showing signs of stabilization.
Momentum Analysis:
- RSI: The Relative Strength Index (RSI) has been hovering around the neutral zone, indicating a lack of strong momentum in either direction.
- Stochastic Oscillator: Both %K and %D have been declining, suggesting a weakening momentum.
- Williams %R: The Williams %R is in the oversold territory, indicating a potential reversal in momentum.
Volatility Analysis:
- Bollinger Bands (BB): The stock price has been trading within the Bollinger Bands, with the bands narrowing, indicating decreasing volatility.
- Bollinger %B: The %B indicator is hovering around the midline, suggesting a balanced volatility level.
Volume Analysis:
- On-Balance Volume (OBV): The OBV has been relatively stable, indicating a neutral volume flow.
- Chaikin Money Flow (CMF): The CMF has been negative, reflecting a bearish money flow trend.
Key Observations:
- The trend indicators suggest a potential bullish reversal with the convergence of MACD lines.
- Momentum indicators show a lack of strong momentum, indicating a possible consolidation phase.
- Volatility is decreasing, signaling a period of stability in price movements.
- Volume indicators reflect a neutral volume flow with a bearish money flow trend.
Conclusion:
Based on the analysis of the technical indicators, the stock price of HELX is likely to experience sideways movement in the next few days. The convergence of the MACD lines and the narrowing Bollinger Bands indicate a potential consolidation phase. However, the lack of strong momentum and bearish money flow trend suggest a cautious approach. Traders may consider waiting for clearer signals before making significant trading decisions.