Technical Analysis of HEQT 2024-05-10
Overview:
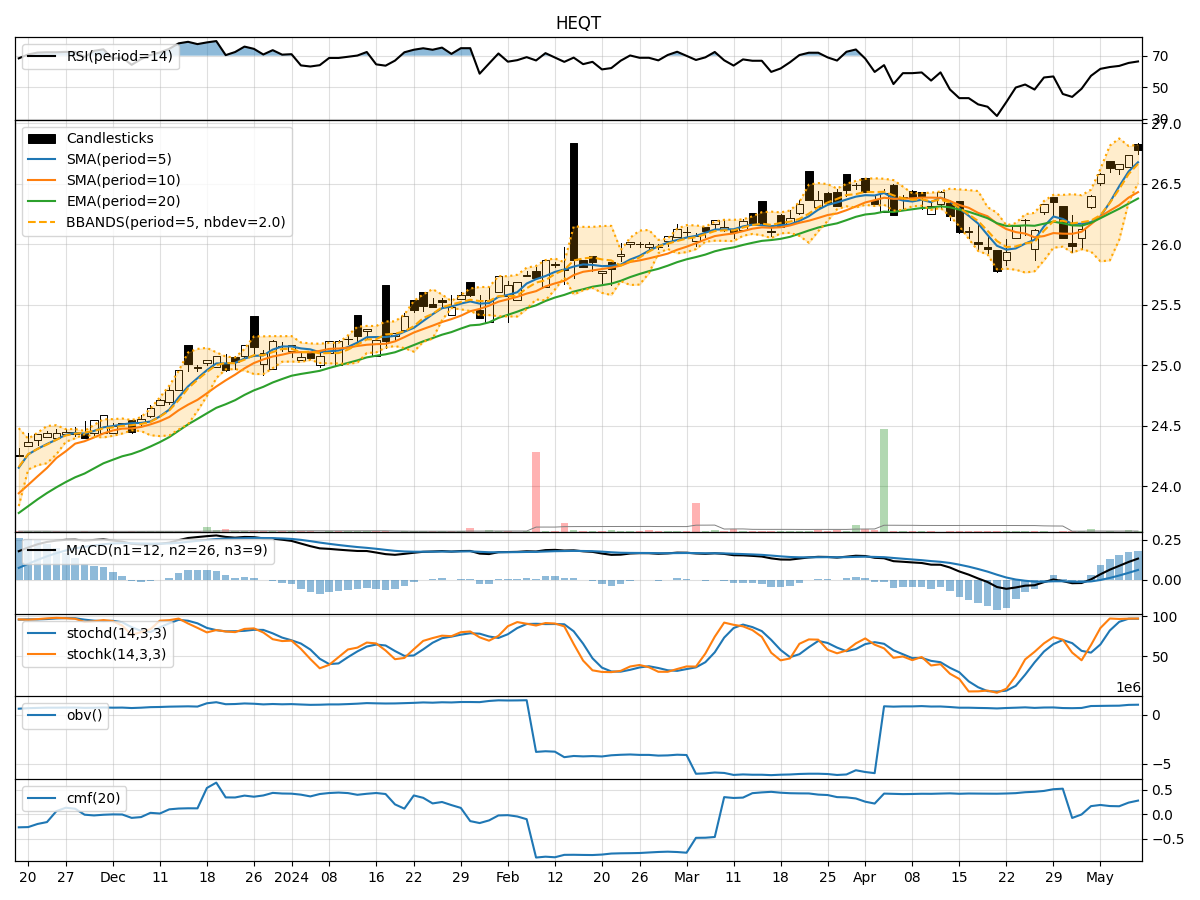
In analyzing the technical indicators for HEQT over the last 5 days, we will delve into the trend, momentum, volatility, and volume indicators to provide a comprehensive outlook on the possible stock price movement in the coming days. By examining these key indicators, we aim to offer valuable insights and predictions to guide your investment decisions.
Trend Analysis:
- Moving Averages (MA): The 5-day Moving Average (MA) has been consistently above the Simple Moving Average (SMA) and Exponential Moving Average (EMA), indicating a bullish trend.
- MACD: The MACD line has been consistently above the signal line, with the MACD histogram showing an increasing positive trend, suggesting bullish momentum.
Momentum Analysis:
- RSI: The Relative Strength Index (RSI) has been trending upwards and is currently in the overbought territory, indicating strong buying momentum.
- Stochastic Oscillator: Both %K and %D lines of the Stochastic Oscillator are in the overbought zone, suggesting a potential reversal or consolidation.
Volatility Analysis:
- Bollinger Bands (BB): The stock price has been trading within the upper Bollinger Band (BBU), indicating high volatility and a potential overbought condition.
- Bollinger Band Percentage (BBP): The BBP is above 0.8, suggesting that the stock price is near the upper band and may experience a pullback.
Volume Analysis:
- On-Balance Volume (OBV): The OBV has been steadily increasing over the last 5 days, indicating strong buying pressure and accumulation of the stock.
- Chaikin Money Flow (CMF): The CMF is positive and has been trending upwards, reflecting bullish money flow into the stock.
Key Observations:
- The trend indicators suggest a strong bullish sentiment in the short term.
- Momentum indicators show overbought conditions, signaling a potential reversal or consolidation.
- Volatility indicators point towards high volatility and a possible pullback.
- Volume indicators indicate strong buying pressure and positive money flow into the stock.
Conclusion:
Based on the analysis of the technical indicators, the next few days' possible stock price movement for HEQT is likely to experience a short-term pullback or consolidation due to the overbought conditions indicated by the momentum and volatility indicators. However, the overall trend remains bullish, supported by strong buying pressure and positive money flow. Traders may consider taking profits or waiting for a better entry point during the anticipated pullback.