Technical Analysis of HERD 2024-05-10
Overview:
In analyzing the technical indicators for HERD stock over the last 5 days, we will delve into the trend, momentum, volatility, and volume indicators to provide a comprehensive outlook on the possible stock price movement in the coming days. By examining these key indicators, we aim to offer valuable insights and predictions to guide your investment decisions.
Trend Indicators:
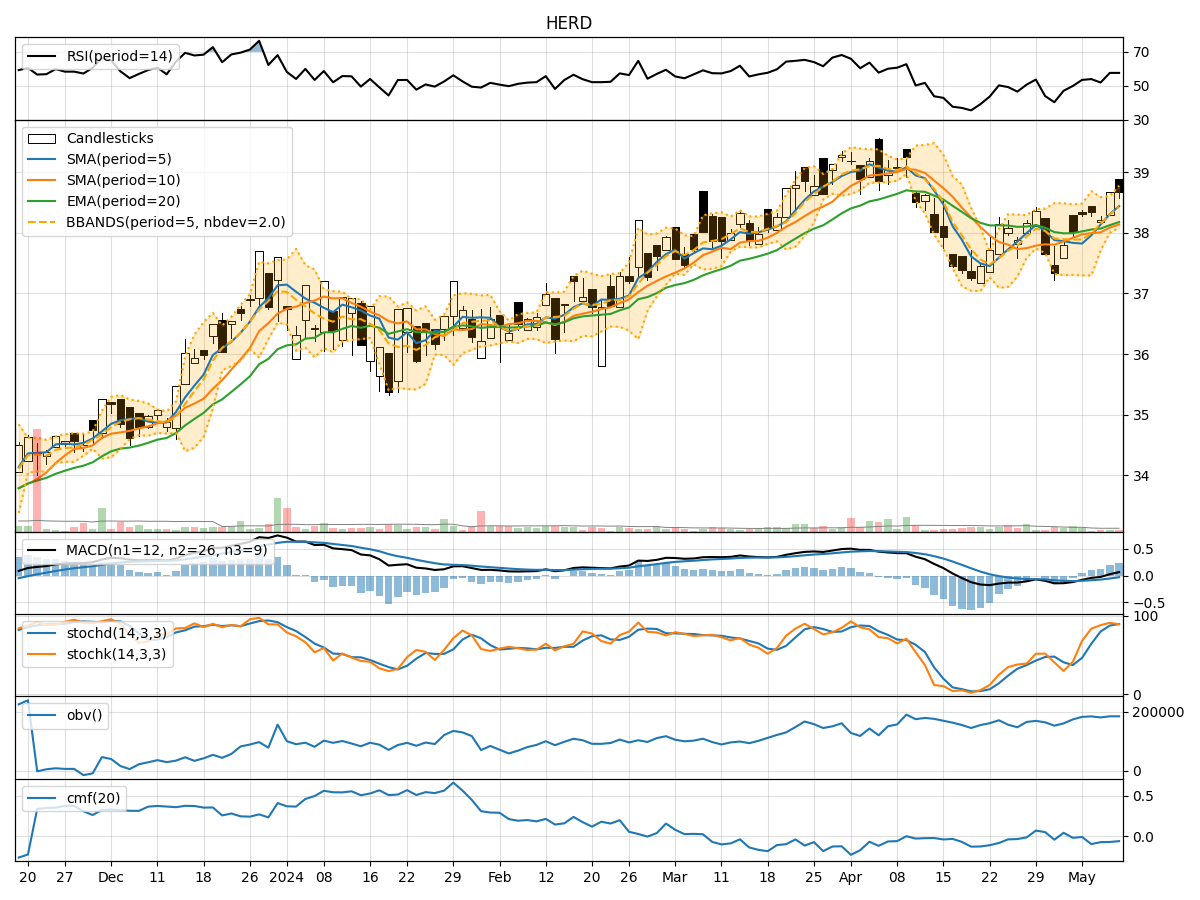
- Moving Averages (MA): The 5-day MA has been consistently above the 10-day SMA, indicating a short-term bullish trend. The EMA(20) has shown a slight upward trajectory, suggesting a positive momentum in the stock price.
- MACD: The MACD line has been above the signal line for the past few days, indicating a bullish trend. The MACD histogram has been increasing, reflecting strengthening bullish momentum.
Momentum Indicators:
- RSI: The RSI has been fluctuating around the 50 level, indicating a neutral momentum in the stock. There is no extreme overbought or oversold conditions.
- Stochastic Oscillator: The stochastic indicators have been in the overbought territory, suggesting a potential reversal or consolidation in the stock price.
Volatility Indicators:
- Bollinger Bands (BB): The stock price has been trading within the Bollinger Bands, with the bands narrowing slightly. This could indicate a period of consolidation or reduced volatility in the stock.
- Bollinger %B (BBP): The %B indicator has been hovering around the midpoint, indicating a balanced market sentiment.
Volume Indicators:
- On-Balance Volume (OBV): The OBV has been relatively flat, suggesting a lack of significant accumulation or distribution in the stock.
- Chaikin Money Flow (CMF): The CMF has been negative, indicating a slight outflow of money from the stock.
Key Observations and Opinions:
- Trend: The trend indicators suggest a bullish bias in the stock price, supported by the moving averages and MACD. However, the EMA(20) shows a potential resistance level.
- Momentum: The momentum indicators are mixed, with RSI indicating neutrality and stochastic oscillators hinting at a possible reversal.
- Volatility: The Bollinger Bands and %B indicator suggest a period of consolidation or reduced volatility in the stock.
- Volume: The volume indicators show a lack of significant buying or selling pressure, with OBV and CMF indicating a neutral to slightly bearish sentiment.
Conclusion:
Based on the analysis of the technical indicators, the next few days' possible stock price movement for HERD is likely to be sideways or consolidating. The bullish trend indicated by the moving averages and MACD may face resistance at the EMA(20) level. The mixed momentum signals and lack of significant volume support the view of a sideways movement. Traders should exercise caution and wait for clearer signals before making significant trading decisions.