Technical Analysis of HEWG 2024-05-10
Overview:
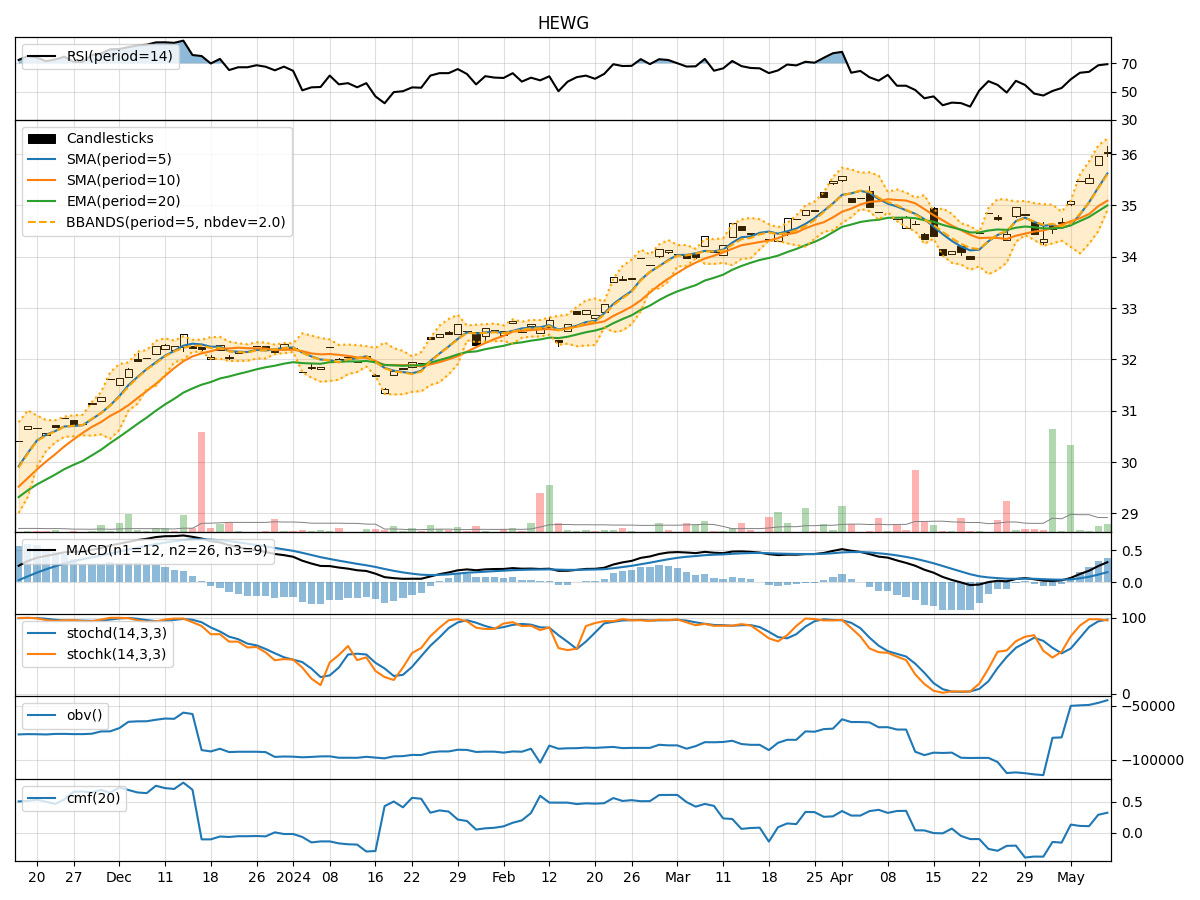
In the last 5 trading days, HEWG stock has shown a consistent uptrend in its price movement. Various technical indicators across trend, momentum, volatility, and volume categories suggest positive momentum and potential for further price appreciation. Let's delve deeper into each category to provide a comprehensive analysis and make a well-informed prediction for the next few days.
Trend Analysis:
- Moving Averages (MA): The 5-day Moving Average (MA) has been consistently above the Simple Moving Average (SMA) and Exponential Moving Average (EMA), indicating a bullish trend.
- MACD: The MACD line has been consistently above the signal line, with both lines showing an upward trajectory, suggesting bullish momentum.
- Conclusion: The trend indicators point towards a strong bullish trend in the stock price.
Momentum Analysis:
- RSI: The Relative Strength Index (RSI) has been consistently above 50, indicating bullish momentum.
- Stochastic Oscillator: Both %K and %D lines of the Stochastic Oscillator have been in the overbought zone, suggesting strong buying pressure.
- Conclusion: Momentum indicators signal a strong bullish momentum in the stock.
Volatility Analysis:
- Bollinger Bands (BB): The stock price has been consistently trading above the middle Bollinger Band (BBM), indicating an uptrend.
- Bollinger Band Width (BBW): The BBW has been relatively stable, suggesting consistent volatility.
- Conclusion: Volatility indicators suggest a stable uptrend with consistent price movement.
Volume Analysis:
- On-Balance Volume (OBV): The OBV has been steadily increasing, indicating strong buying volume.
- Chaikin Money Flow (CMF): The CMF has been consistently positive, reflecting buying pressure.
- Conclusion: Volume indicators point towards increasing buying interest in the stock.
Overall Conclusion:
Based on the analysis of trend, momentum, volatility, and volume indicators, the next few days are likely to see a continuation of the bullish trend in HEWG stock. Investors can consider buying or holding positions in anticipation of further price appreciation. It is important to monitor the indicators closely for any signs of reversal or weakening bullish momentum.
Key Takeaways:
- Upward Trend: The stock is in a strong bullish trend.
- Bullish Momentum: Momentum indicators support the bullish outlook.
- Stable Volatility: Volatility remains consistent, supporting the uptrend.
- Increasing Buying Volume: Volume indicators show rising buying interest.
Recommendation:
Based on the technical analysis and indicators, it is recommended to consider buying HEWG stock for potential short to medium-term gains. However, it is crucial to monitor the market conditions and indicators regularly for any changes in the trend or momentum.