Technical Analysis of HF 2024-05-10
Overview:
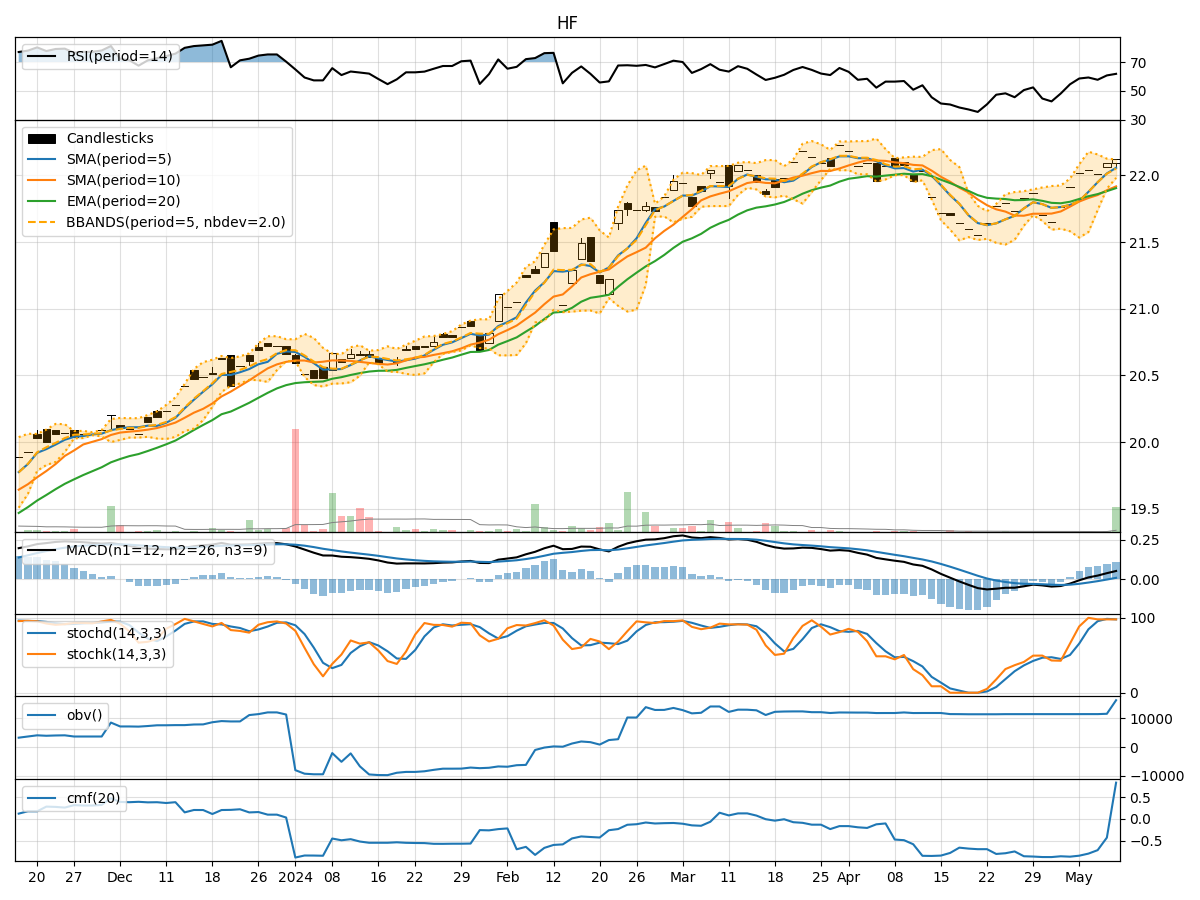
In analyzing the technical indicators for the last 5 days of HF stock, we will delve into the trend, momentum, volatility, and volume indicators to provide insights into the possible future stock price movements. By examining these key indicators, we aim to offer a comprehensive analysis and make informed predictions for the upcoming days.
Trend Analysis:
- Moving Averages (MA): The 5-day MA has been consistently above the closing prices, indicating a short-term uptrend.
- MACD: The MACD line has been above the signal line for the past 5 days, suggesting bullish momentum.
- RSI: The RSI values have been above 50, indicating strength in the current uptrend.
Key Observation: The trend indicators suggest a bullish sentiment in the stock price movement.
Momentum Analysis:
- Stochastic Oscillator: Both %K and %D values have been consistently high, indicating strong buying momentum.
- Williams %R: The values have been around 0, suggesting the stock is in overbought territory.
Key Observation: Momentum indicators signal a strong buying pressure in the market.
Volatility Analysis:
- Bollinger Bands (BB): The bands have been narrowing, indicating decreasing volatility.
- BB %B: The %B values have been above 0.5, suggesting the stock is trading above the mid-band.
Key Observation: Volatility has been decreasing, potentially leading to a period of consolidation.
Volume Analysis:
- On-Balance Volume (OBV): The OBV has been steadily increasing, indicating accumulation by investors.
- Chaikin Money Flow (CMF): The CMF has been negative, suggesting selling pressure in the market.
Key Observation: The volume indicators show mixed signals with accumulation in OBV but selling pressure in CMF.
Conclusion:
Based on the analysis of the technical indicators, the next few days for HF stock are likely to see continued upward movement with strong bullish momentum. The trend indicators support a bullish sentiment, while momentum indicators indicate strong buying pressure. However, the decreasing volatility and mixed volume signals suggest a potential period of consolidation before further upside movement.
Recommendation: Consider holding onto existing positions or initiating new long positions with caution, as the stock is in overbought territory. Keep a close eye on volume and volatility indicators for any signs of reversal or consolidation.
Overall Sentiment: Bullish with a potential for consolidation in the near term.