Technical Analysis of HFND 2024-05-10
Overview:
In analyzing the technical indicators for HFND over the last 5 days, we will delve into the trend, momentum, volatility, and volume indicators to provide a comprehensive outlook on the possible stock price movement in the coming days. By examining these key indicators, we aim to offer valuable insights and predictions for informed decision-making.
Trend Analysis:
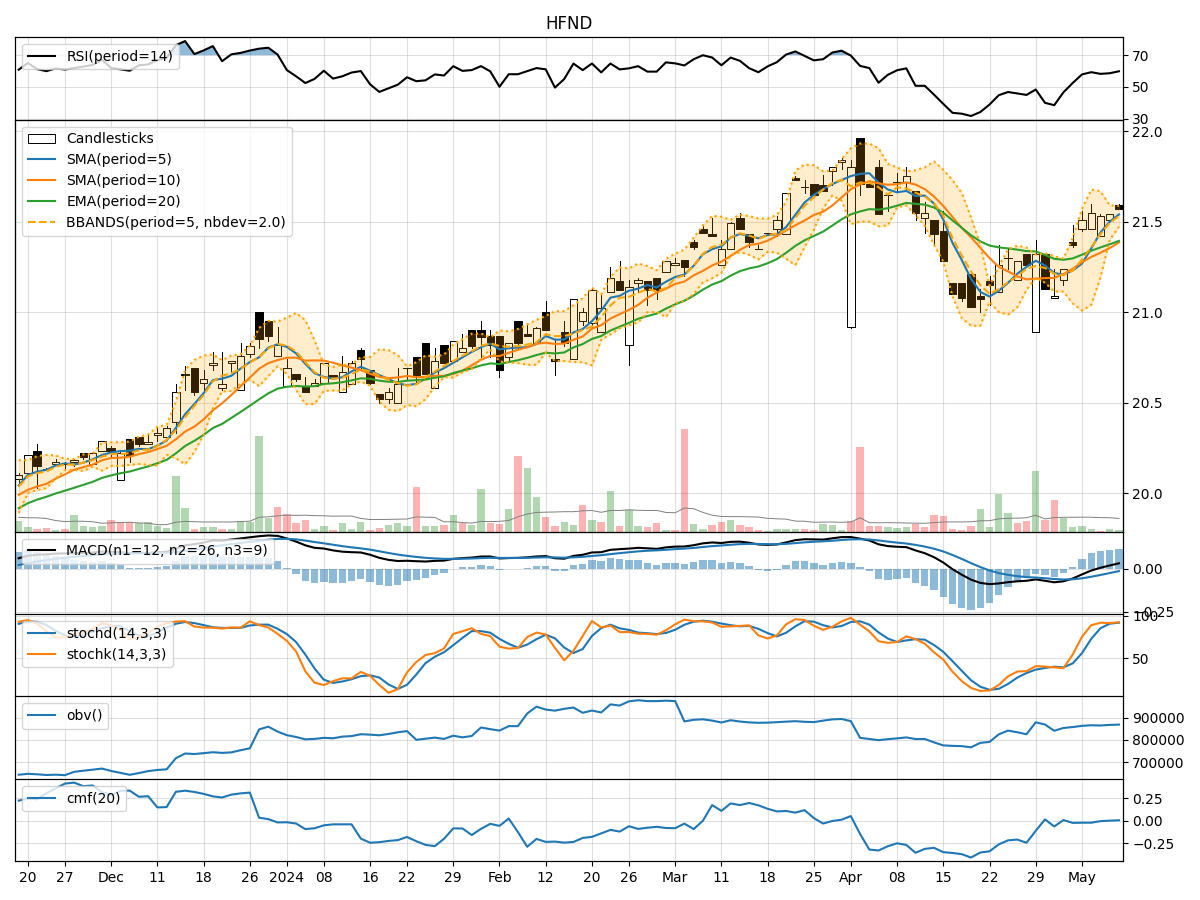
- Moving Averages (MA): The 5-day Moving Average (MA) has been trending above the Simple Moving Average (SMA) and Exponential Moving Average (EMA), indicating a short-term bullish trend.
- MACD: The Moving Average Convergence Divergence (MACD) has been consistently positive, with the MACD line above the signal line, suggesting bullish momentum.
- MACD Histogram: The MACD Histogram has been increasing, indicating strengthening bullish momentum.
Momentum Analysis:
- RSI: The Relative Strength Index (RSI) has been hovering around 60-70, indicating a neutral to slightly bullish momentum.
- Stochastic Oscillator: Both %K and %D lines of the Stochastic Oscillator are in the overbought zone, suggesting a potential reversal or consolidation.
- Williams %R: The Williams %R is in the oversold territory, indicating a potential buying opportunity.
Volatility Analysis:
- Bollinger Bands: The stock price has been trading within the Bollinger Bands, with the bands narrowing, suggesting decreasing volatility.
- Bollinger %B: The %B indicator is around 0.8, indicating that the stock price is closer to the upper band, potentially signaling a near-term pullback.
Volume Analysis:
- On-Balance Volume (OBV): The OBV has shown mixed signals, fluctuating between positive and negative values, reflecting indecision in the market.
- Chaikin Money Flow (CMF): The CMF has been slightly negative, indicating some selling pressure in the stock.
Conclusion:
Based on the analysis of the technical indicators: - Trend: The stock is in an upward trend supported by moving averages and MACD. - Momentum: The momentum is neutral to slightly bullish based on RSI and stochastic indicators. - Volatility: Volatility is decreasing, as indicated by the narrowing Bollinger Bands. - Volume: The volume indicators suggest mixed signals, with no clear direction.
Overall View:
Considering the overall technical analysis, the stock of HFND is likely to experience further upside movement in the coming days, supported by the bullish trend and momentum indicators. However, traders should remain cautious of potential reversals indicated by overbought conditions in the Stochastic Oscillator. It is advisable to closely monitor price action and key support/resistance levels for timely decision-making.