Technical Analysis of HGER 2024-05-10
Overview:
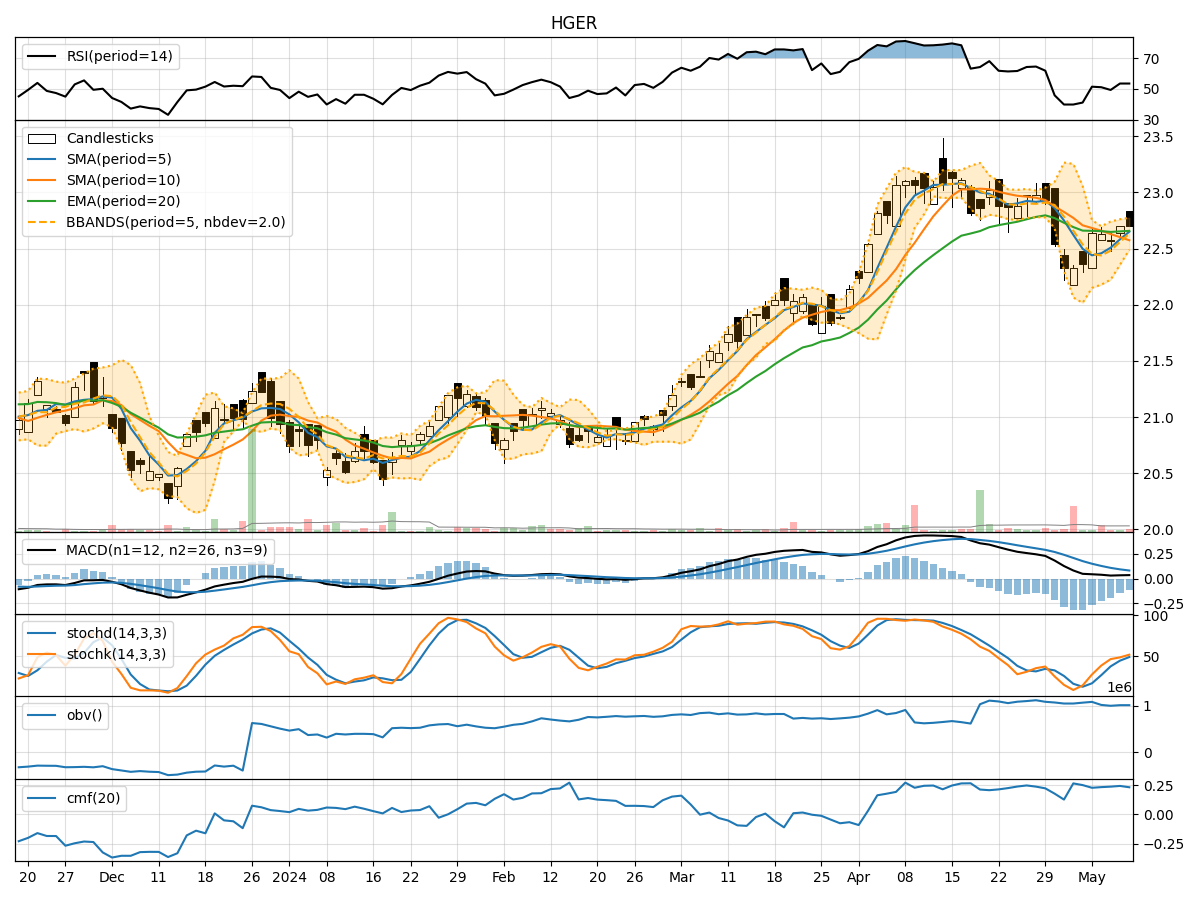
In analyzing the technical indicators for HGER stock over the last 5 days, we will delve into the trend, momentum, volatility, and volume indicators to provide a comprehensive outlook on the possible stock price movement in the coming days.
Trend Analysis:
- Moving Averages (MA): The 5-day Moving Average (MA) has been showing an upward trend, indicating a positive momentum in the stock price.
- MACD: The Moving Average Convergence Divergence (MACD) has been consistently positive, suggesting a bullish trend.
- EMA: The Exponential Moving Average (EMA) has been relatively stable, indicating a steady price movement.
Momentum Analysis:
- RSI: The Relative Strength Index (RSI) has been hovering around the neutral zone, indicating a balanced momentum.
- Stochastic Oscillator: Both %K and %D have been trending upwards, signaling a strengthening momentum.
- Williams %R: The Williams %R is in the oversold territory, suggesting a potential reversal in the momentum.
Volatility Analysis:
- Bollinger Bands: The Bollinger Bands have been narrowing, indicating decreasing volatility in the stock price.
- Bollinger %B: The %B indicator has been fluctuating within a tight range, reflecting stable volatility levels.
Volume Analysis:
- On-Balance Volume (OBV): The OBV has been relatively flat, suggesting a balance between buying and selling pressure.
- Chaikin Money Flow (CMF): The CMF has been positive, indicating a flow of money into the stock.
Key Observations:
- The trend indicators suggest a bullish sentiment with positive moving averages and MACD.
- Momentum indicators show a mixed picture with RSI in a neutral zone but Stochastic Oscillator indicating a potential uptrend.
- Volatility has been decreasing, indicating a possible consolidation phase.
- Volume indicators reflect a balanced buying and selling pressure.
Conclusion:
Based on the analysis of the technical indicators, the stock price of HGER is likely to experience a sideways movement in the coming days. The bullish trend indicated by moving averages and MACD may be offset by the neutral momentum and decreasing volatility. Investors should closely monitor key support and resistance levels for potential breakout opportunities. Exercise caution and wait for clearer signals before making significant trading decisions.