Technical Analysis of HIBL 2024-05-10
Overview:
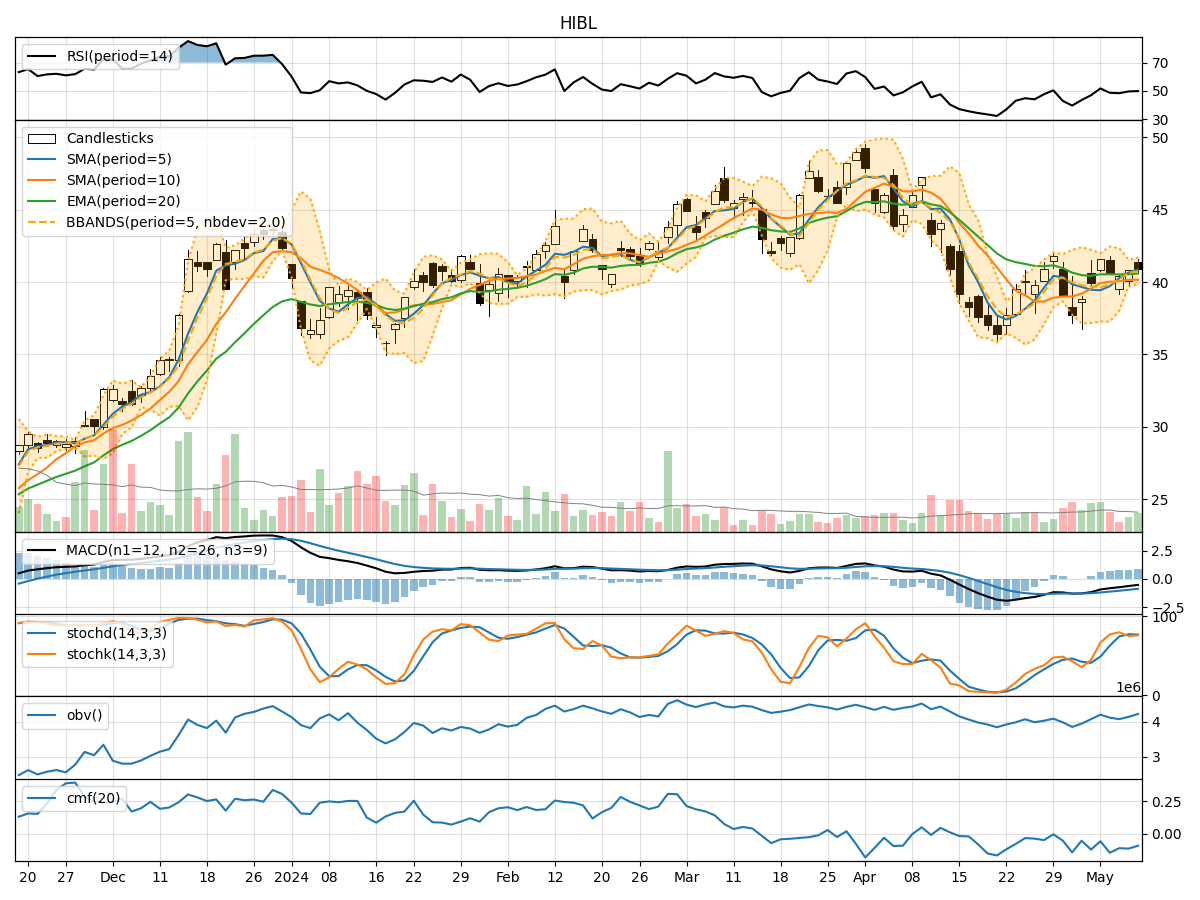
In analyzing the technical indicators for HIBL over the last 5 days, we will delve into the trend, momentum, volatility, and volume indicators to provide a comprehensive outlook on the possible stock price movement in the coming days.
Trend Indicators:
- Moving Averages (MA): The 5-day MA has been consistently above the closing prices, indicating a short-term uptrend.
- MACD: The MACD has been negative but showing signs of convergence towards the signal line, suggesting a potential reversal.
- RSI: The RSI has been hovering around the neutral zone, indicating a balanced market sentiment.
Momentum Indicators:
- Stochastic Oscillator: The stochastic indicators have been fluctuating in the overbought territory, signaling a potential reversal or consolidation.
- Williams %R: The Williams %R has been in the oversold region, indicating a possible buying opportunity.
Volatility Indicators:
- Bollinger Bands (BB): The Bollinger Bands have been narrowing, suggesting a decrease in volatility and a potential breakout.
- Average True Range (ATR): The ATR has been relatively stable, indicating consistent price movements.
Volume Indicators:
- On-Balance Volume (OBV): The OBV has shown mixed signals, reflecting indecision among market participants.
- Chaikin Money Flow (CMF): The CMF has been negative, indicating selling pressure in the market.
Key Observations:
- The trend indicators suggest a potential reversal or consolidation in the short term.
- Momentum indicators point towards a possible shift in market sentiment.
- Volatility indicators indicate a potential breakout or continuation of the current trend.
- Volume indicators reflect mixed signals, with no clear direction in investor participation.
Conclusion:
Based on the analysis of the technical indicators, the next few days' possible stock price movement for HIBL is likely to experience consolidation with a slight upward bias. Traders should closely monitor the MACD for a bullish crossover confirmation and the Stochastic Oscillator for potential reversal signals. Additionally, keeping an eye on the Bollinger Bands for a breakout and the OBV for any significant volume spikes will be crucial in determining the stock's future direction. Overall, a cautious approach with a focus on key technical levels and confirmation signals is recommended in navigating the upcoming price action.