Technical Analysis of HIBS 2024-05-10
Overview:
In analyzing the technical indicators for HIBS stock over the last 5 days, we will delve into the trend, momentum, volatility, and volume indicators to provide a comprehensive outlook on the possible stock price movement in the coming days. By examining these key indicators, we aim to offer valuable insights and predictions for potential investors.
Trend Analysis:
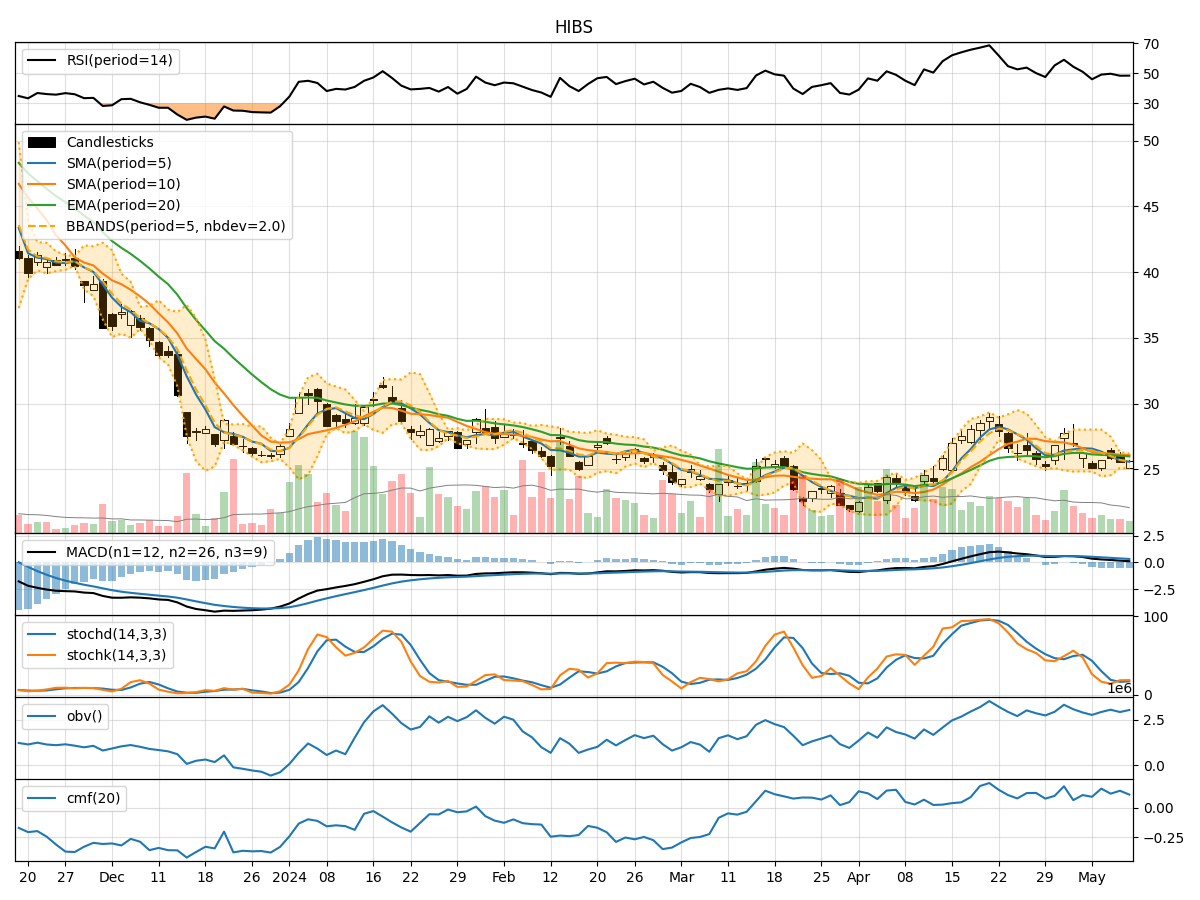
- Moving Averages (MA): The 5-day Moving Average (MA) is below the Simple Moving Average (SMA) and Exponential Moving Average (EMA), indicating a downward trend.
- MACD: The MACD line is above the signal line, suggesting a bullish momentum.
- RSI: The Relative Strength Index (RSI) is below 50, indicating a bearish sentiment.
- Bollinger Bands: The stock price is trading below the middle Bollinger Band, signaling a bearish trend.
Momentum Analysis:
- Stochastic Oscillator: Both %K and %D are below 20, indicating an oversold condition.
- Williams %R: The Williams %R is below -80, suggesting the stock is oversold.
Volatility Analysis:
- Bollinger Bands Width: The Bollinger Bands Width is expanding, indicating increased volatility.
- Average True Range (ATR): ATR is relatively stable, suggesting consistent price movements.
Volume Analysis:
- On-Balance Volume (OBV): The OBV is showing mixed signals with fluctuations in volume.
- Chaikin Money Flow (CMF): The CMF is positive but trending downwards, indicating potential selling pressure.
Key Observations:
- The trend indicators suggest a bearish sentiment with the stock price below key moving averages.
- Momentum indicators point towards an oversold condition, potentially signaling a reversal.
- Volatility indicators show an increase in price fluctuations, which could lead to significant price movements.
- Volume indicators reflect mixed signals, with no clear trend in volume accumulation.
Conclusion:
Based on the analysis of technical indicators, the stock price of HIBS is likely to experience a short-term downward movement due to the bearish trend and oversold conditions. However, the expanding volatility suggests potential for sharp price swings. Investors should exercise caution and consider waiting for a clearer signal before making any trading decisions. Overall, the outlook for HIBS in the next few days leans towards a bearish bias with potential for increased volatility.