Technical Analysis of HIDE 2024-05-10
Overview:
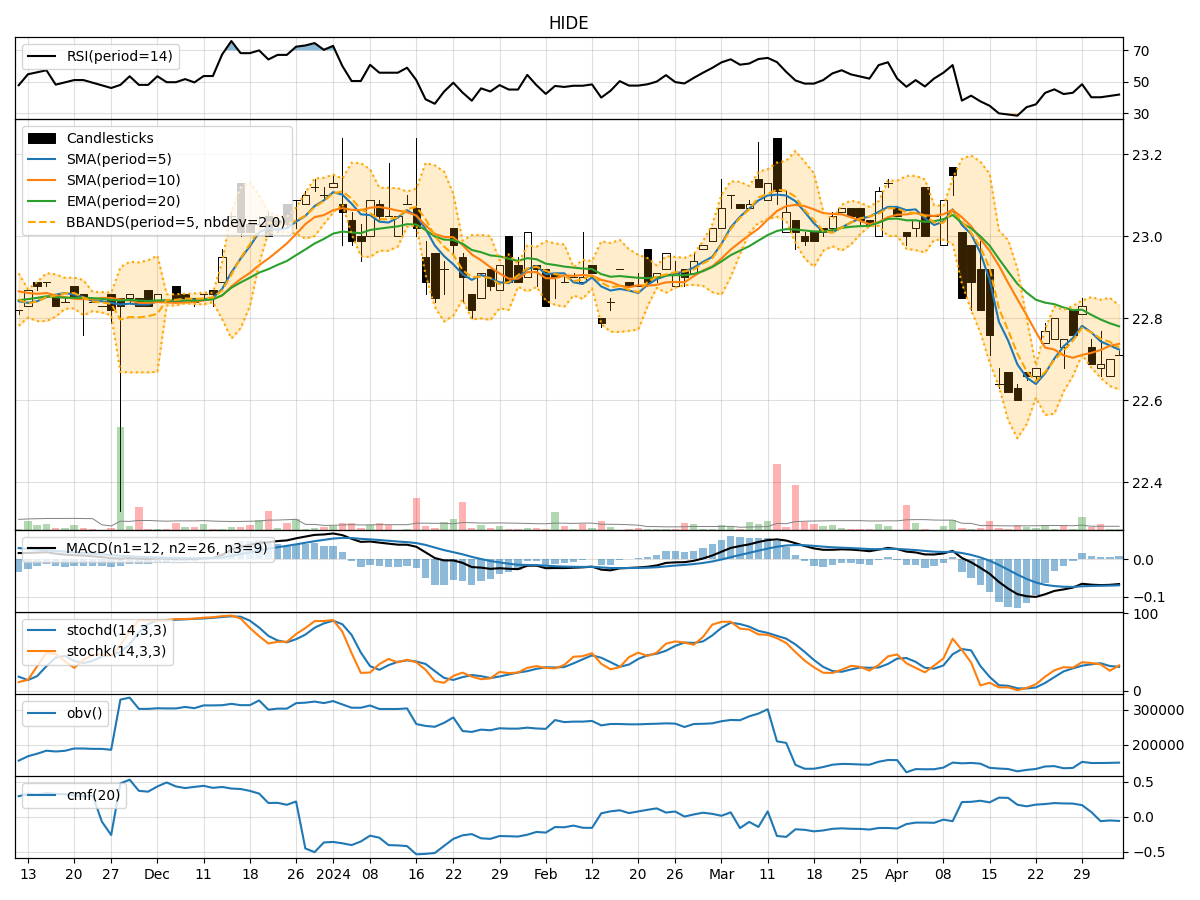
In the last 5 trading days, the stock has shown relatively stable price movements with minor fluctuations. The trend indicators suggest a slightly bearish sentiment, while momentum indicators show a neutral to slightly bearish outlook. Volatility indicators indicate decreasing volatility, and volume indicators show a consistent but slightly negative trend.
Trend Indicators Analysis:
- Moving averages (MA) and exponential moving averages (EMA) have been relatively flat, indicating a lack of strong trend direction.
- The Moving Average Convergence Divergence (MACD) is negative, suggesting a bearish momentum.
- The MACD Histogram (MACDH) is positive but decreasing, indicating a potential weakening of the bearish momentum.
Momentum Indicators Analysis:
- The Relative Strength Index (RSI) is below 50, indicating a bearish sentiment.
- Stochastic Oscillator (StochK and StochD) are also trending downwards, suggesting a bearish momentum.
- Williams %R (WillR) is in the oversold territory, indicating a potential reversal or consolidation.
Volatility Indicators Analysis:
- Bollinger Bands (BB) are narrowing, indicating decreasing volatility.
- The %B indicator is above 0.5, suggesting the price is closer to the upper band.
- The Bollinger Band Width (BBW) is decreasing, indicating a potential decrease in volatility.
Volume Indicators Analysis:
- On-Balance Volume (OBV) is slightly negative, indicating a slight distribution of the stock.
- Chaikin Money Flow (CMF) is negative, suggesting a bearish sentiment in the money flow.
Key Observations:
- The stock is currently in a consolidation phase with a slightly bearish bias.
- The decreasing volatility and negative volume indicators suggest a lack of strong buying interest.
- The momentum indicators align with the bearish sentiment, indicating a potential continuation of the downward trend.
Conclusion:
Based on the analysis of the technical indicators, the next few days are likely to see further downward movement in the stock price. The bearish trend and momentum, coupled with decreasing volatility and negative volume indicators, indicate a lack of strong buying support. Traders and investors should exercise caution and consider short-term selling opportunities or wait for a clearer bullish reversal signal before considering long positions.