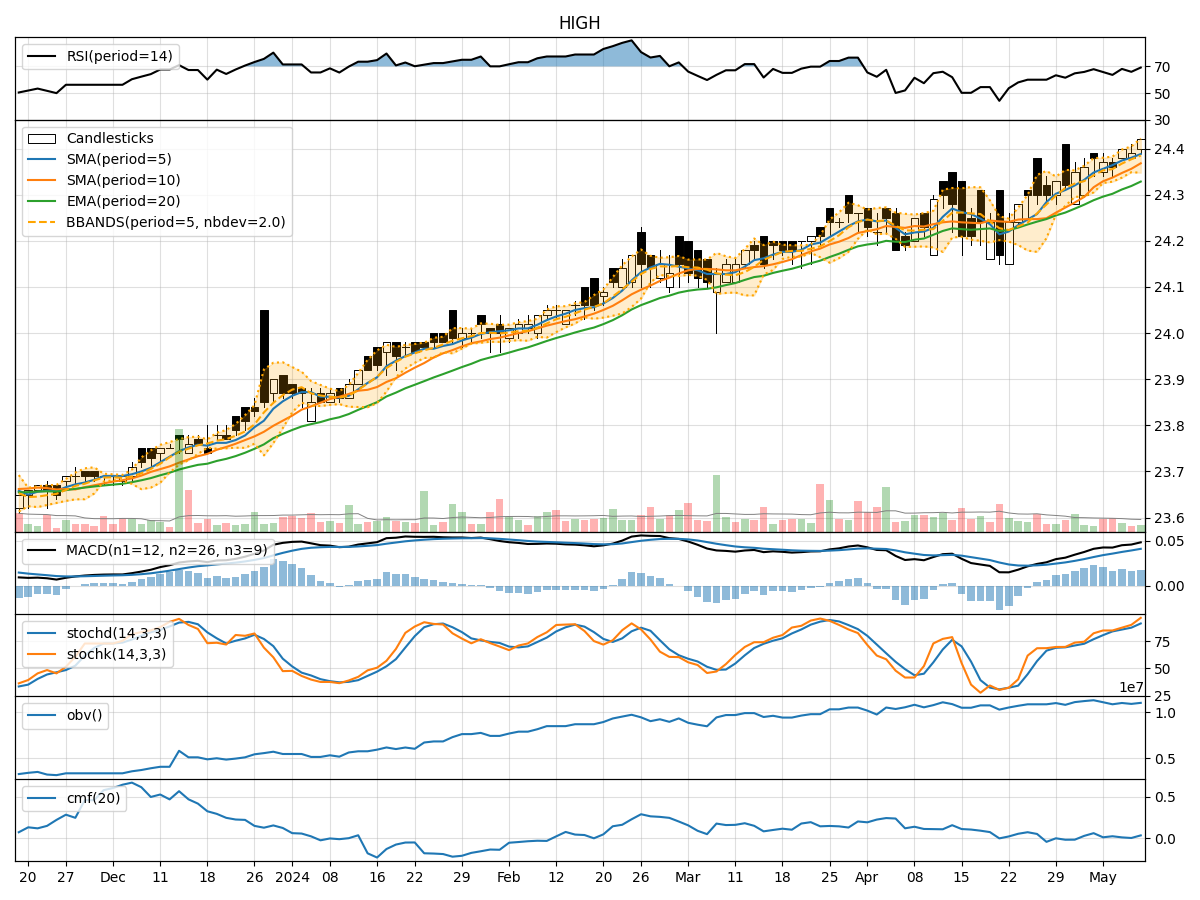
Technical Analysis of HIGH 2024-05-10
Overview:
In the last 5 trading days, the stock has shown a consistent uptrend based on the moving averages, MACD, and momentum indicators. The volatility has been relatively stable, and the volume has shown positive accumulation.
Trend Indicators Analysis:
- Moving Averages (MA): The stock price has been consistently above the 5-day moving average, indicating a short-term uptrend.
- MACD: The MACD line has been above the signal line, showing bullish momentum.
- EMA: The exponential moving average has been trending upwards, supporting the bullish sentiment.
Key Observation: The trend indicators suggest a strong bullish sentiment in the stock.
Momentum Indicators Analysis:
- RSI: The Relative Strength Index has been in the overbought territory, indicating strong buying momentum.
- Stochastic Oscillator: Both %K and %D lines have been in the overbought zone, signaling a strong uptrend.
- Williams %R: The Williams %R has been consistently in the oversold region, suggesting a potential reversal.
Key Observation: The momentum indicators reflect a strong bullish momentum in the stock.
Volatility Indicators Analysis:
- Bollinger Bands: The stock price has been trading within the upper Bollinger Band, indicating an overbought condition.
- Bollinger %B: The %B indicator has been above 0.8, suggesting a potential reversal.
- Bollinger Band Width: The band width has been relatively stable, indicating consistent volatility.
Key Observation: The volatility indicators hint at a potential consolidation or reversal in the stock price.
Volume Indicators Analysis:
- On-Balance Volume (OBV): The OBV has been steadily increasing, showing positive accumulation.
- Chaikin Money Flow (CMF): The CMF has been positive, indicating buying pressure.
Key Observation: The volume indicators support the bullish trend in the stock.
Conclusion:
Based on the comprehensive analysis of the technical indicators, the stock is currently in a strong bullish phase with positive momentum and volume accumulation. However, the overbought conditions in the momentum and volatility indicators suggest a potential consolidation or reversal in the near future. Traders should closely monitor the price action for signs of a pullback or trend reversal.
Recommendation:
- Short-term: Consider taking profits or tightening stop-loss levels as the stock may experience a consolidation phase.
- Long-term: Hold positions with caution and wait for a clear signal before making new entries.
Disclaimer:
Remember that technical analysis is not a guaranteed predictor of future price movements, and other fundamental factors can influence stock prices. It is essential to conduct thorough research and consider multiple indicators before making any investment decisions. Consulting with a financial advisor is recommended for personalized investment advice.