Technical Analysis of HISF 2024-05-10
Overview:
In analyzing the technical indicators for HISF stock over the last 5 days, we will delve into the trend, momentum, volatility, and volume indicators to provide a comprehensive outlook on the possible stock price movement in the coming days. By examining these key indicators, we aim to offer valuable insights and predictions for informed decision-making.
Trend Analysis:
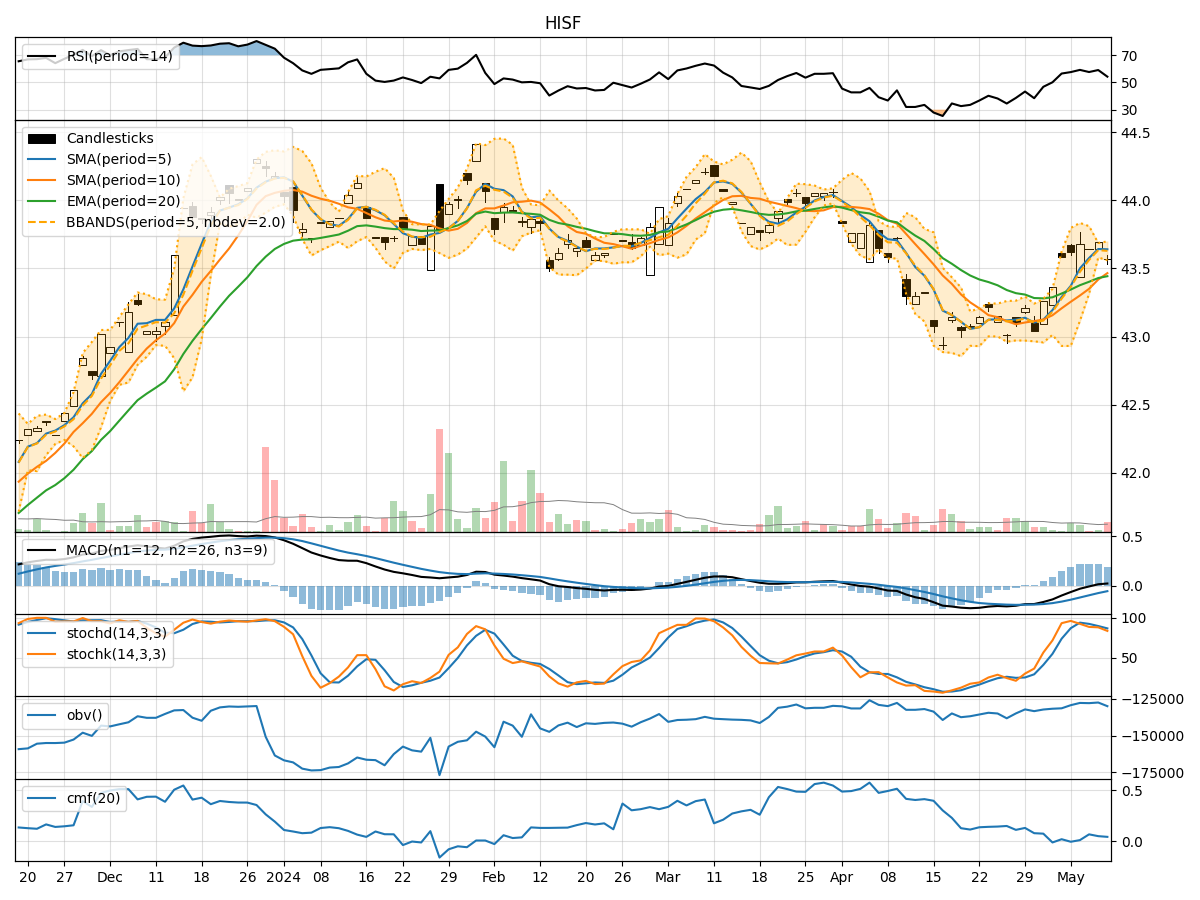
- Moving Averages (MA): The 5-day Moving Average (MA) has been consistently above the Simple Moving Average (SMA) and Exponential Moving Average (EMA), indicating a bullish trend.
- MACD: The MACD line has been consistently above the signal line, suggesting a bullish momentum in the stock price.
- MACD Histogram: The MACD Histogram has been showing positive values, further supporting the bullish sentiment in the stock.
Momentum Analysis:
- RSI: The Relative Strength Index (RSI) has been fluctuating around the 50 level, indicating a neutral momentum in the stock.
- Stochastic Oscillator: Both %K and %D lines of the Stochastic Oscillator have been gradually decreasing, signaling a potential reversal in momentum.
- Williams %R: The Williams %R indicator has been in the oversold territory, suggesting a possible buying opportunity.
Volatility Analysis:
- Bollinger Bands: The Bollinger Bands have been relatively narrow, indicating low volatility in the stock price.
- Bollinger %B: The %B indicator has been hovering around the middle range, reflecting a neutral stance in terms of volatility.
Volume Analysis:
- On-Balance Volume (OBV): The OBV indicator has been fluctuating, indicating a balance between buying and selling pressure.
- Chaikin Money Flow (CMF): The CMF has been positive, suggesting a bullish money flow into the stock.
Key Observations:
- The trend indicators suggest a bullish sentiment in the stock, supported by the MACD and moving averages.
- Momentum indicators show a neutral to slightly bearish momentum, with potential signs of a reversal.
- Volatility remains low, indicating stability in the stock price.
- Volume indicators reflect a balanced buying and selling pressure, with a slight bullish bias.
Conclusion:
Based on the analysis of the technical indicators, the next few days' possible stock price movement for HISF is likely to be sideways with a slight bullish bias. While the trend indicators point towards a bullish sentiment, the momentum indicators suggest a neutral to bearish momentum that may lead to a consolidation phase. The low volatility and balanced volume further support the sideways movement with a potential upward bias. Traders should closely monitor key support and resistance levels for potential entry and exit points.