Technical Analysis of HIYS 2024-05-10
Overview:
In analyzing the technical indicators for HIYS stock over the last 5 days, we will delve into the trend, momentum, volatility, and volume indicators to provide a comprehensive outlook on the possible future stock price movement. By examining key metrics such as moving averages, MACD, RSI, Bollinger Bands, and OBV, we aim to offer valuable insights and recommendations for potential trading strategies.
Trend Indicators:
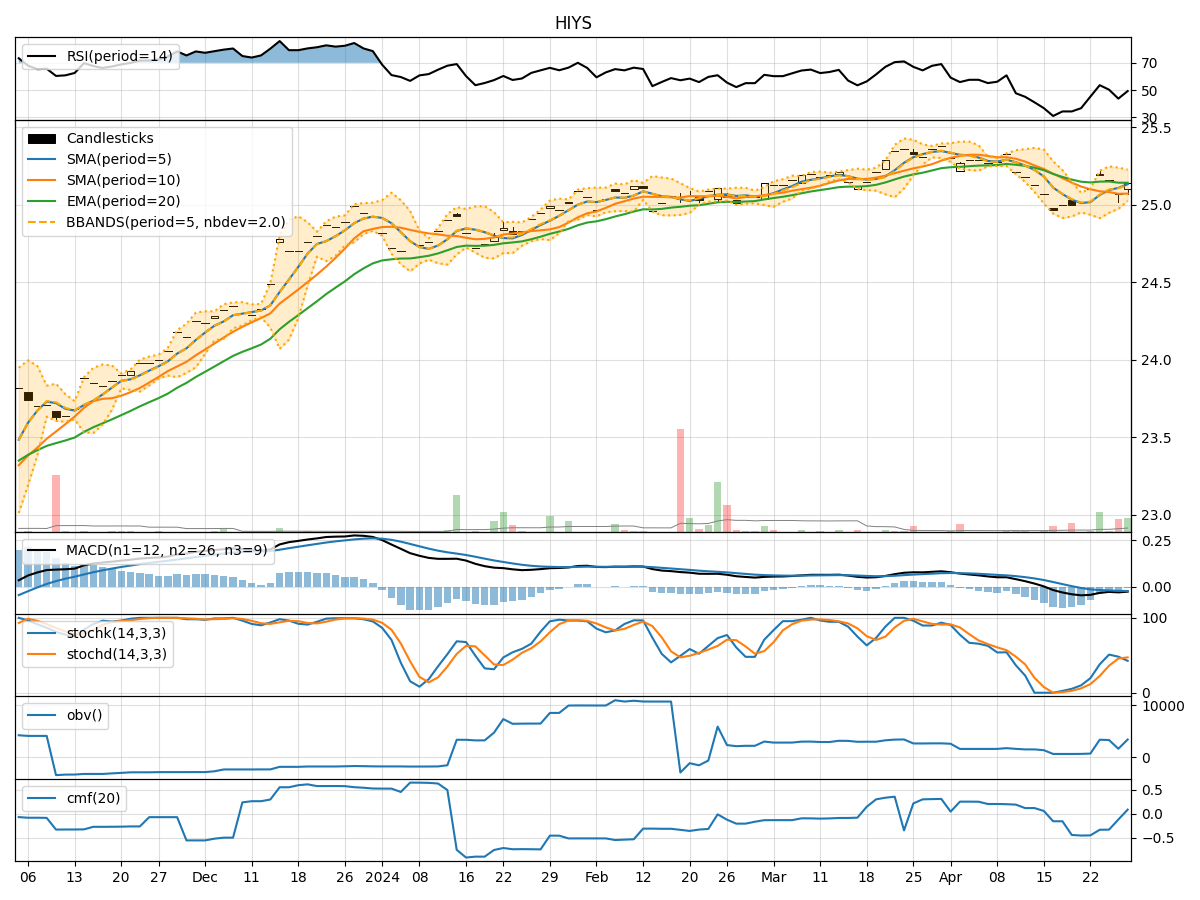
- Moving Averages (MA): The 5-day MA has been consistently above the 10-day SMA, indicating a short-term bullish trend.
- MACD: The MACD line has been trending upwards, with the MACD histogram showing positive values, suggesting increasing bullish momentum.
- EMA: The 20-day EMA has been steadily rising, supporting the bullish trend.
Momentum Indicators:
- RSI: The RSI has been hovering in the neutral to slightly overbought territory, indicating moderate buying pressure.
- Stochastic Oscillator: Both %K and %D have been declining, signaling a potential reversal in momentum.
- Williams %R: The indicator has been in oversold territory, suggesting a possible upcoming bullish reversal.
Volatility Indicators:
- Bollinger Bands (BB): The stock price has been trading within the bands, indicating a period of consolidation.
- BB Width: The narrowing of the bands suggests decreasing volatility and a potential breakout in the near future.
Volume Indicators:
- On-Balance Volume (OBV): The OBV has been relatively flat, indicating a balance between buying and selling pressure.
- Chaikin Money Flow (CMF): The CMF has been close to zero, reflecting a lack of strong buying or selling momentum.
Conclusion:
Based on the analysis of the technical indicators, the stock is likely to experience sideways movement in the near term. The bullish trend indicated by moving averages and MACD may face resistance due to the overbought RSI and declining stochastic indicators. The narrowing Bollinger Bands suggest a period of consolidation, while the flat OBV and near-zero CMF point to a lack of significant buying or selling pressure.
In conclusion, the stock is expected to trade within a tight range in the coming days, with potential for a bullish breakout if buying momentum strengthens. Traders should closely monitor key levels and wait for confirmation signals before initiating any new positions.