Technical Analysis of HJAN 2024-05-10
Overview:
In analyzing the technical indicators for HJAN stock over the last 5 days, we will delve into the trend, momentum, volatility, and volume indicators to provide a comprehensive outlook on the possible stock price movement in the coming days.
Trend Analysis:
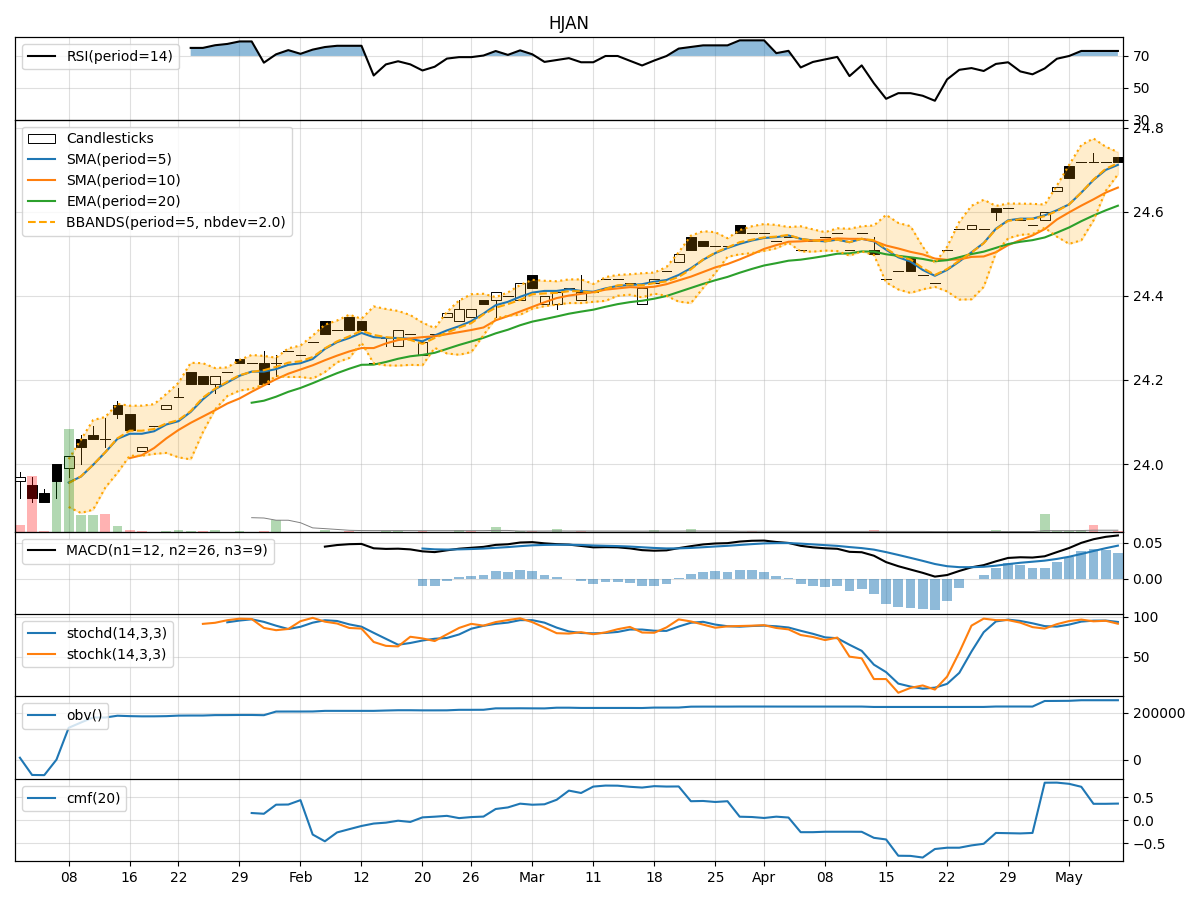
- Moving Averages (MA): The 5-day Moving Average (MA) has been consistently above the Simple Moving Average (SMA) and Exponential Moving Average (EMA), indicating a bullish trend.
- MACD: The MACD line has been consistently above the signal line, with both lines showing an upward trend, suggesting bullish momentum.
Momentum Analysis:
- RSI: The Relative Strength Index (RSI) has been consistently above 70, indicating overbought conditions but also strong bullish momentum.
- Stochastic Oscillator: Both %K and %D have been relatively high, suggesting strong upward momentum.
Volatility Analysis:
- Bollinger Bands (BB): The stock price has been consistently trading above the middle Bollinger Band (BBM), indicating an upward trend with moderate volatility.
Volume Analysis:
- On-Balance Volume (OBV): The OBV has been relatively stable, indicating consistent buying pressure.
- Chaikin Money Flow (CMF): The CMF has been positive, indicating that money is flowing into the stock.
Key Observations:
- The trend indicators suggest a strong bullish trend with the moving averages and MACD supporting upward momentum.
- Momentum indicators like RSI and Stochastic Oscillator indicate overbought conditions but also strong bullish momentum.
- Volatility remains moderate as per Bollinger Bands, supporting a steady uptrend.
- Volume indicators show consistent buying pressure with positive OBV and CMF.
Conclusion:
Based on the analysis of the technical indicators, the stock is likely to continue its upward movement in the coming days. The strong bullish trend, supported by momentum and volume indicators, suggests that the stock price may experience further gains. Traders and investors could consider buying opportunities in line with the prevailing uptrend. It is important to monitor the indicators for any signs of reversal or consolidation, but the current outlook remains bullish.