Technical Analysis of HJEN 2024-05-10
Overview:
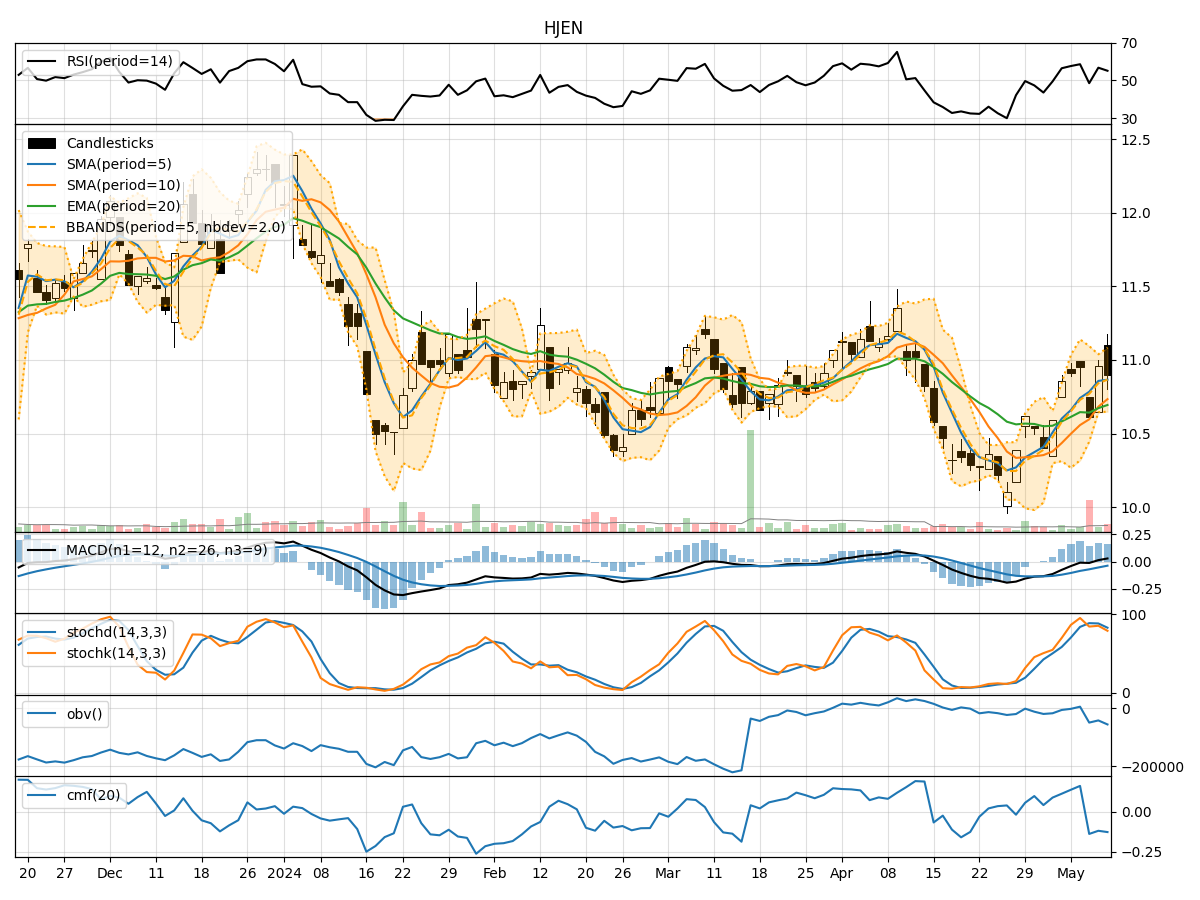
In analyzing the technical indicators for HJEN stock over the last 5 days, we will delve into the trends, momentum, volatility, and volume indicators to provide a comprehensive outlook on the possible future stock price movement. By examining these key indicators, we aim to offer valuable insights and predictions for the upcoming trading days.
Trend Analysis:
- Moving Averages (MA): The 5-day Moving Average (MA) has been fluctuating around the closing prices, indicating short-term price trends. The Simple Moving Average (SMA) and Exponential Moving Average (EMA) show a slight upward trend, suggesting potential bullish momentum.
- MACD: The Moving Average Convergence Divergence (MACD) has been positive, with the MACD line consistently above the signal line. This signals a bullish trend in the stock price.
- Conclusion: The trend indicators suggest an upward momentum in the stock price.
Momentum Analysis:
- RSI: The Relative Strength Index (RSI) has been hovering around the neutral zone, indicating neither overbought nor oversold conditions.
- Stochastic Oscillator: Both %K and %D have shown fluctuations but have not reached extreme levels, suggesting a balanced momentum.
- Conclusion: The momentum indicators imply a neutral stance in the stock price movement.
Volatility Analysis:
- Bollinger Bands (BB): The Bollinger Bands have shown narrowing bands, indicating decreasing volatility in the stock price.
- Conclusion: The volatility indicators suggest a stabilizing price movement with reduced fluctuations.
Volume Analysis:
- On-Balance Volume (OBV): The OBV has shown mixed movements, indicating indecision among investors regarding the stock.
- Chaikin Money Flow (CMF): The CMF has been negative, suggesting selling pressure in the stock.
- Conclusion: The volume indicators point towards uncertainty in the stock price direction.
Overall Conclusion:
Based on the analysis of the technical indicators, the stock of HJEN is likely to experience upward momentum in the coming days, supported by the positive trend indicators such as the MACD. However, the neutral momentum and uncertain volume indicators suggest a potential consolidation phase or sideways movement in the short term. The decreasing volatility indicates a stabilizing price action.
Recommendation:
Considering the overall analysis, it is advisable to monitor the stock closely for any signs of a breakout or reversal in the current trend. Traders may consider buying on dips within a defined risk management strategy. Long-term investors should wait for more clarity in the price direction before making significant investment decisions.
Disclaimer:
This analysis is based solely on technical indicators and historical data, and it is essential to consider other fundamental factors and market dynamics before making any investment decisions. It is recommended to consult with a financial advisor for personalized advice tailored to individual investment goals and risk tolerance levels.