Technical Analysis of HLAL 2024-05-10
Overview:
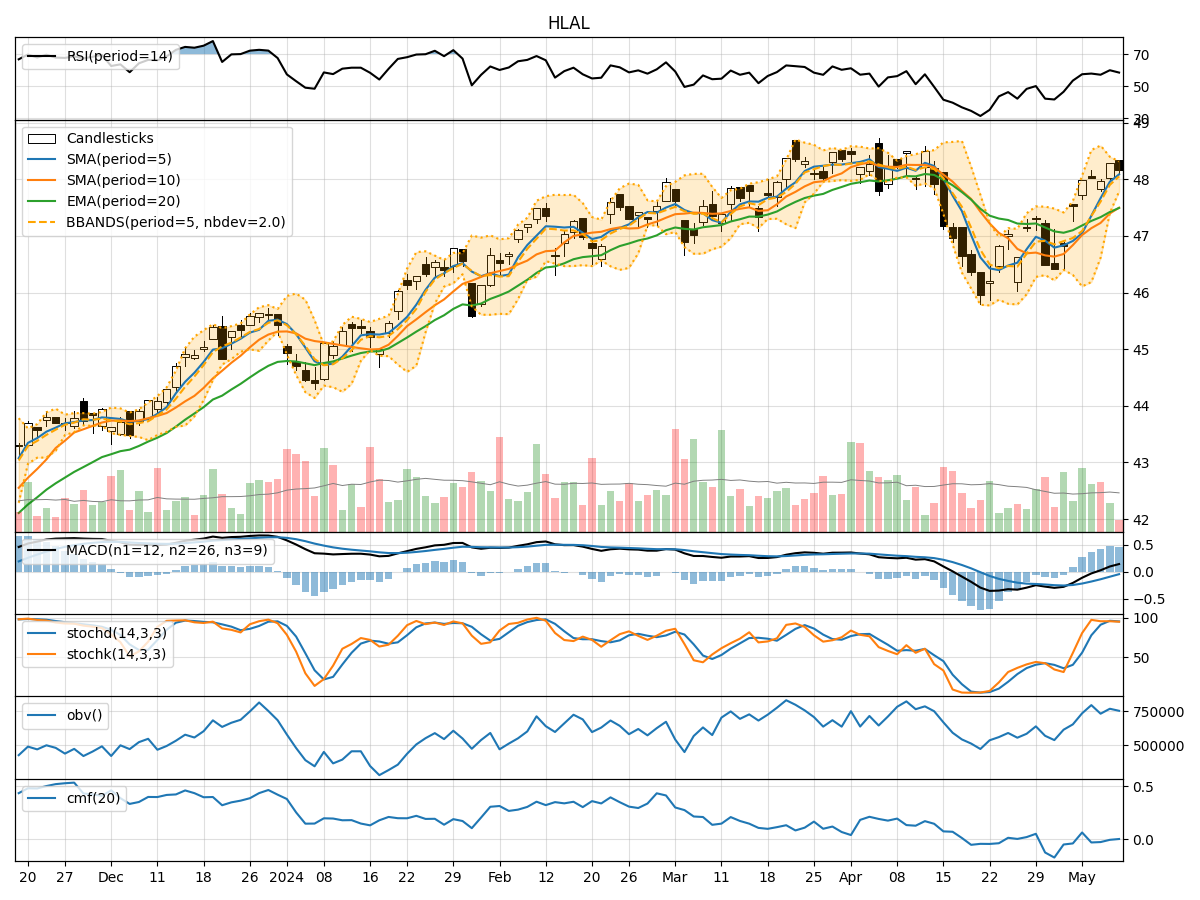
In analyzing the technical indicators for HLAL over the last 5 days, we will delve into the trend, momentum, volatility, and volume indicators to provide a comprehensive outlook on the possible stock price movement. By examining these key aspects, we aim to offer valuable insights and predictions for the upcoming days.
Trend Analysis:
- Moving Averages (MA): The 5-day Moving Average (MA) has been trending upwards, indicating a positive momentum in the stock price.
- MACD: The Moving Average Convergence Divergence (MACD) has shown a consistent increase in the MACD line, suggesting a strengthening bullish trend.
- EMA: The Exponential Moving Average (EMA) has been on an upward trajectory, supporting the bullish sentiment in the short to medium term.
Momentum Analysis:
- RSI: The Relative Strength Index (RSI) has been fluctuating around the overbought territory, indicating a strong buying momentum.
- Stochastic Oscillator: Both %K and %D have been consistently high, signaling a strong bullish momentum in the stock.
- Williams %R: The Williams %R is hovering near oversold levels, suggesting a potential reversal in the short term.
Volatility Analysis:
- Bollinger Bands: The Bollinger Bands have been narrowing, indicating decreasing volatility and a possible period of consolidation.
- Bollinger %B: The %B indicator is currently below 1, suggesting the stock is trading below the lower Bollinger Band, potentially indicating an oversold condition.
Volume Analysis:
- On-Balance Volume (OBV): The OBV has shown mixed signals, with fluctuations in volume accumulation, indicating indecision among market participants.
- Chaikin Money Flow (CMF): The CMF has been negative, suggesting a slight outflow of money from the stock in the short term.
Conclusion:
Based on the analysis of the technical indicators, the stock of HLAL is bullish in the short to medium term. The trend indicators, momentum oscillators, and moving averages all point towards a continuation of the upward trend. However, the narrowing Bollinger Bands and mixed volume signals suggest a possible period of consolidation or a minor pullback before resuming the uptrend.
Recommendation:
Considering the overall bullish sentiment and positive momentum, investors may consider buying on dips or holding their positions for potential further upside. It is essential to monitor the price action closely for any signs of reversal or trend exhaustion. Additionally, setting stop-loss orders to protect profits and manage risk is advisable in this scenario.