Technical Analysis of HLGE 2024-05-10
Overview:
In analyzing the technical indicators for HLGE over the last 5 days, we will delve into the trend, momentum, volatility, and volume indicators to provide a comprehensive outlook on the possible stock price movement. By examining these key aspects, we aim to offer valuable insights and predictions for the upcoming days.
Trend Indicators:
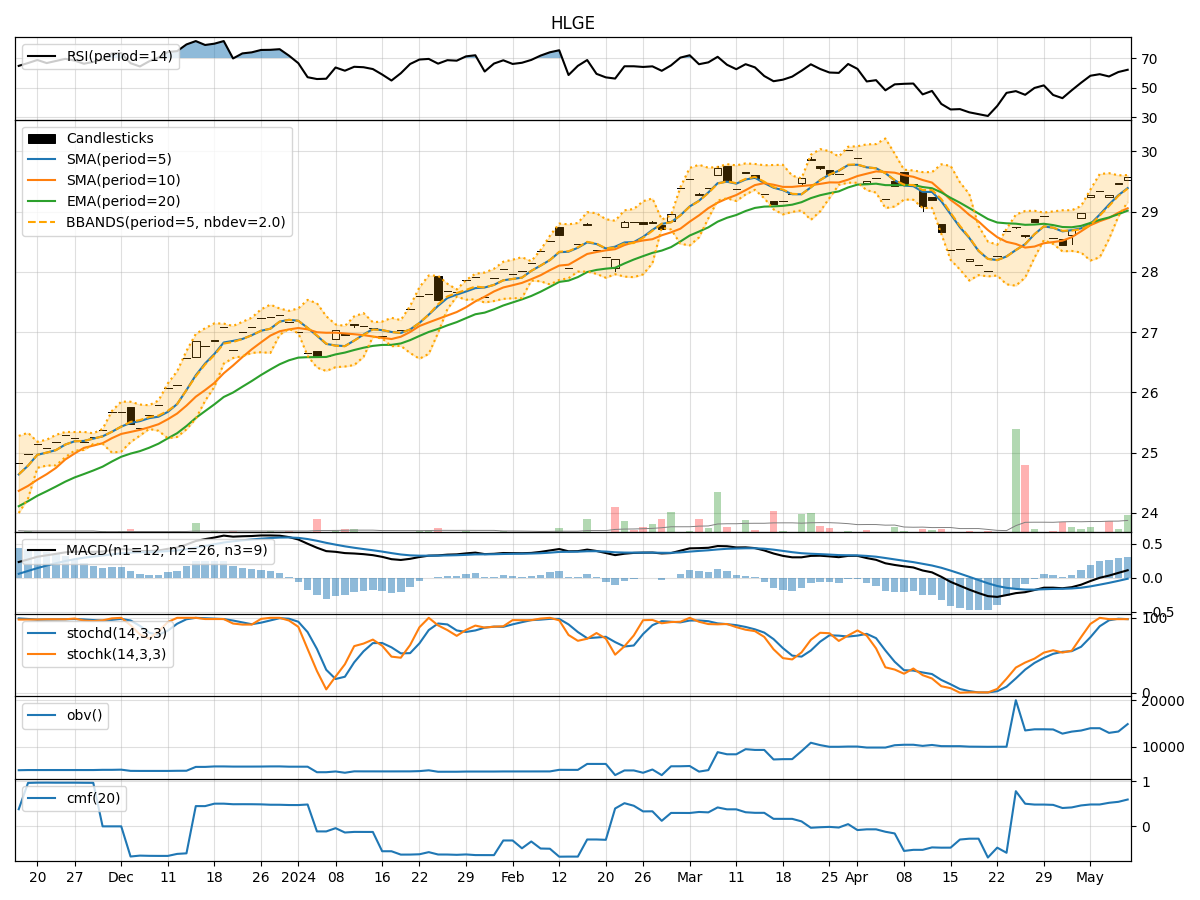
- Moving Averages (MA): The 5-day Moving Average has been consistently above the Simple Moving Average (SMA) and Exponential Moving Average (EMA), indicating a bullish trend.
- MACD: The MACD line has been consistently above the signal line, with both lines showing an upward trend, suggesting bullish momentum.
- MACD Histogram: The MACD Histogram has been increasing over the last 5 days, indicating strengthening bullish momentum.
Momentum Indicators:
- RSI: The Relative Strength Index (RSI) has been trending upwards and is currently in the overbought territory, suggesting a strong bullish momentum.
- Stochastic Oscillator: Both %K and %D lines of the Stochastic Oscillator are in the overbought zone, indicating a strong bullish momentum.
- Williams %R: The Williams %R is also in the overbought region, further supporting the bullish sentiment.
Volatility Indicators:
- Bollinger Bands: The Bollinger Bands have been narrowing, indicating decreasing volatility in the stock price.
- Bollinger %B: The %B value is above 0.8, suggesting that the stock price is trading near the upper band, potentially signaling an overbought condition.
Volume Indicators:
- On-Balance Volume (OBV): The OBV has been increasing over the last 5 days, indicating strong buying pressure in the stock.
- Chaikin Money Flow (CMF): The CMF has been trending upwards, reflecting positive money flow into the stock.
Key Observations and Opinions:
- Trend: The trend indicators suggest a strong bullish sentiment in the stock, supported by moving averages and MACD analysis.
- Momentum: Momentum indicators like RSI, Stochastic Oscillator, and Williams %R all point towards a robust bullish momentum.
- Volatility: The narrowing Bollinger Bands indicate decreasing volatility, potentially leading to a period of consolidation.
- Volume: Increasing OBV and rising CMF indicate strong buying interest and positive money flow into the stock.
Conclusion:
Based on the analysis of the technical indicators, the next few days for HLGE are likely to see continued upward movement in the stock price. The strong bullish trend, supported by momentum and volume indicators, suggests that investors are optimistic about the stock's potential. However, given the overbought conditions in some indicators, a brief period of consolidation or a minor pullback may occur before the uptrend resumes. Overall, the outlook for HLGE remains bullish in the short term.