Technical Analysis of HMOP 2024-05-10
Overview:
In analyzing the technical indicators for HMOP stock over the last 5 days, we will delve into the trend, momentum, volatility, and volume indicators to provide a comprehensive outlook on the possible stock price movement in the coming days. By examining these key indicators, we aim to offer valuable insights and predictions for informed decision-making.
Trend Analysis:
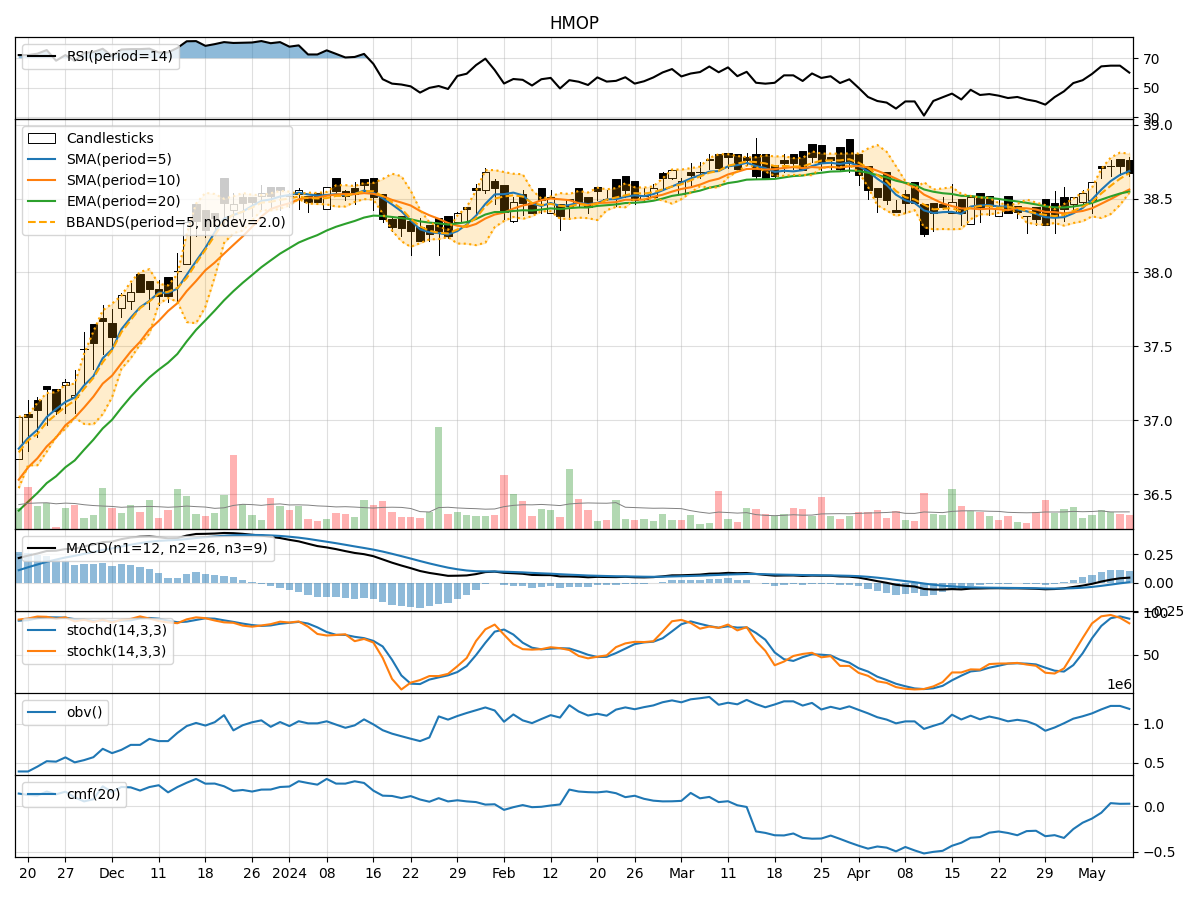
- Moving Averages (MA): The 5-day Moving Average (MA) has been trending slightly upwards, indicating a positive momentum in the short term.
- MACD: The Moving Average Convergence Divergence (MACD) has shown a consistent increase over the past 5 days, suggesting a strengthening bullish trend.
- EMA: The Exponential Moving Average (EMA) has been steadily rising, supporting the bullish sentiment in the stock.
Momentum Analysis:
- RSI: The Relative Strength Index (RSI) has been in the overbought territory, indicating a strong bullish momentum.
- Stochastic Oscillator: Both %K and %D have been in the overbought zone, signaling a potential reversal or consolidation.
- Williams %R: The Williams %R is in the oversold region, suggesting a possible bearish reversal.
Volatility Analysis:
- Bollinger Bands: The Bollinger Bands have shown a narrowing of the bands, indicating decreasing volatility and a potential period of consolidation.
- Bollinger %B: The %B indicator is hovering around the midpoint, suggesting a balanced market sentiment.
Volume Analysis:
- On-Balance Volume (OBV): The OBV has shown mixed signals, with no clear trend in volume accumulation or distribution.
- Chaikin Money Flow (CMF): The CMF has been fluctuating around the zero line, indicating indecision among market participants.
Key Observations:
- The trend indicators suggest a bullish bias in the short term, supported by the positive movement in moving averages and MACD.
- Momentum indicators point towards a potential reversal or consolidation, as the RSI and Stochastic Oscillator are in extreme zones.
- Volatility indicators indicate a period of reduced volatility and possible consolidation ahead.
- Volume indicators show mixed signals, reflecting uncertainty in market participation.
Conclusion:
Based on the analysis of the technical indicators, the stock price of HMOP is likely to experience a period of consolidation in the coming days. While the trend remains bullish in the short term, the momentum indicators suggest a possible reversal or sideways movement. The decreasing volatility and mixed volume signals further support the view of a consolidation phase. Traders should exercise caution and closely monitor key support and resistance levels for potential entry or exit points.
Recommendation:
- Short-term Traders: Consider taking profits or tightening stop-loss levels during the consolidation phase.
- Long-term Investors: Monitor the price action for potential entry points at key support levels.
- Risk Management: Implement proper risk management strategies to protect capital in case of unexpected price movements.
In conclusion, the technical analysis indicates a sideways movement or consolidation for HMOP stock in the near future. It is essential to stay vigilant and adapt to changing market conditions to make informed trading decisions.