Technical Analysis of HOCT 2024-05-10
Overview:
In analyzing the technical indicators for HOCT over the last 5 days, we will delve into the trend, momentum, volatility, and volume indicators to provide a comprehensive outlook on the possible stock price movement. By examining these key aspects, we aim to offer valuable insights and predictions for the upcoming trading days.
Trend Indicators:
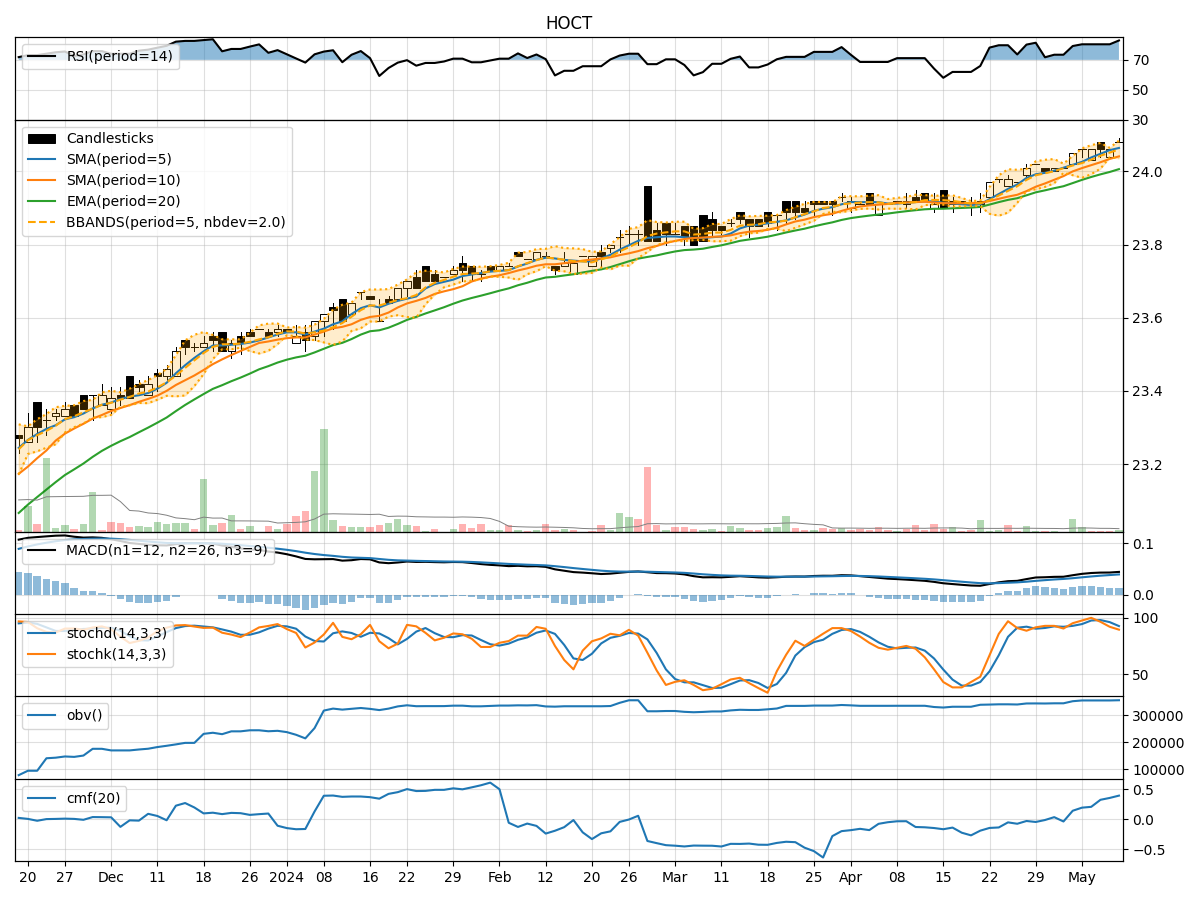
- Moving Averages (MA): The 5-day MA has been consistently above the closing price, indicating a short-term uptrend.
- MACD: The MACD line has been trending upwards, with the MACD histogram showing positive values, suggesting bullish momentum.
- RSI: The RSI has been relatively high, indicating overbought conditions but also strong bullish momentum.
Momentum Indicators:
- Stochastic Oscillator: The Stochastic Oscillator has been in the overbought territory, suggesting a potential reversal or consolidation.
- Williams %R (WillR): The Williams %R has been fluctuating around oversold levels, indicating potential buying opportunities.
Volatility Indicators:
- Bollinger Bands (BB): The Bollinger Bands have been relatively narrow, indicating low volatility and a potential breakout in either direction.
- Average True Range (ATR): The ATR has been relatively stable, suggesting consistent price movements.
Volume Indicators:
- On-Balance Volume (OBV): The OBV has been relatively flat, indicating a balance between buying and selling pressure.
- Chaikin Money Flow (CMF): The CMF has been positive, suggesting inflows into the stock.
Key Observations:
- The trend indicators suggest a bullish bias in the short term, supported by the moving averages and MACD.
- Momentum indicators show mixed signals, with the Stochastic Oscillator hinting at a potential reversal.
- Volatility indicators point towards a potential breakout, as the Bollinger Bands are narrowing.
- Volume indicators indicate a balanced market sentiment, with no clear dominance of buying or selling pressure.
Conclusion:
Based on the analysis of the technical indicators, the next few days' possible stock price movement for HOCT could be sideways consolidation with a slight upward bias. Traders should closely monitor the Stochastic Oscillator for potential reversal signals and the Bollinger Bands for a breakout confirmation. Overall, the stock is likely to trade within a range with intermittent price fluctuations.