Technical Analysis of HODL 2024-05-10
Overview:
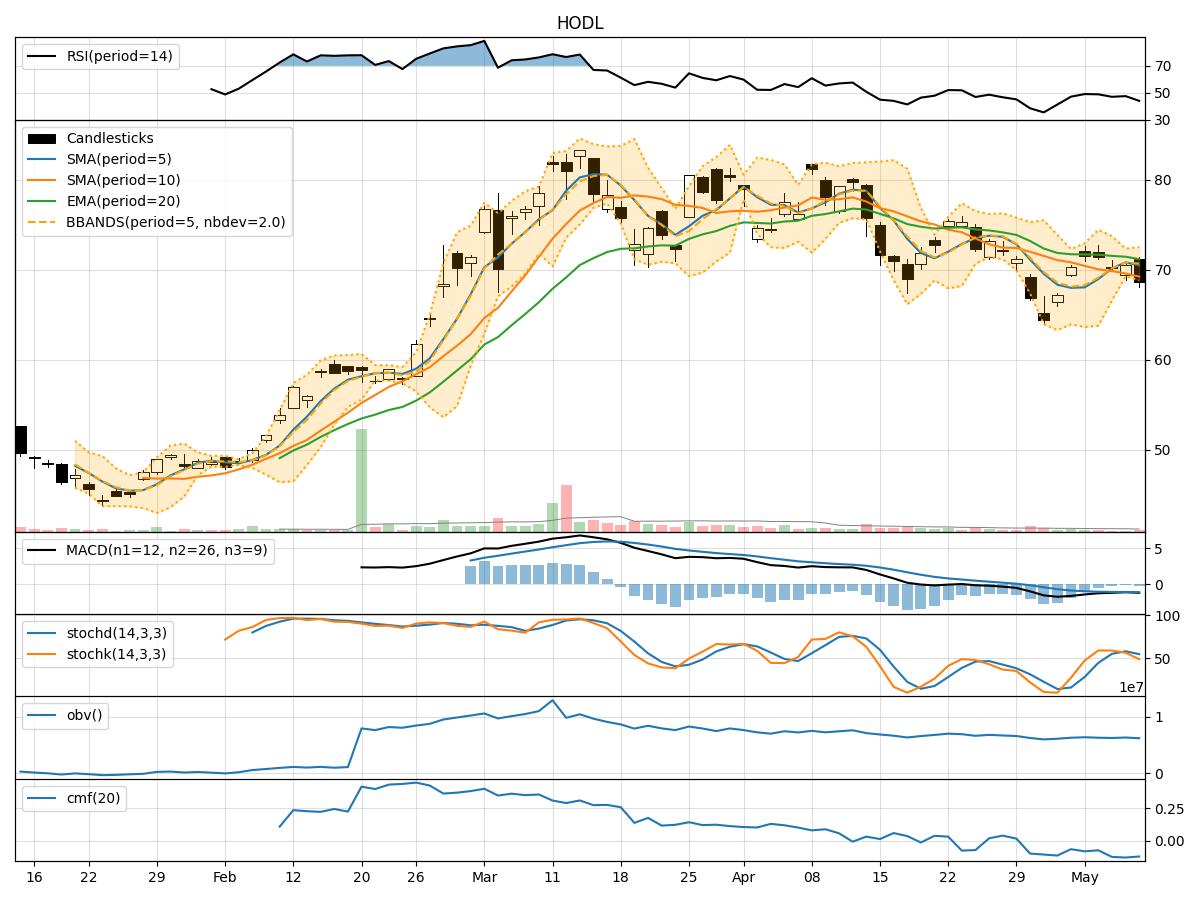
In the last 5 trading days, the stock price has shown some fluctuations with decreasing closing prices. Various technical indicators such as Moving Averages, MACD, RSI, Stochastic Oscillator, Bollinger Bands, and Volume indicators have been analyzed to provide insights into the possible future stock price movements.
Trend Analysis:
- Moving Averages (MA): The 5-day Moving Average has been above the closing prices, indicating a short-term uptrend. However, the stock price has been below the 10-day Simple Moving Average, suggesting a potential reversal.
- MACD (Moving Average Convergence Divergence): The MACD line has been below the signal line, indicating a bearish trend. The MACD Histogram has been decreasing, signaling weakening bearish momentum.
Momentum Analysis:
- RSI (Relative Strength Index): The RSI has been fluctuating around the 50 level, indicating indecision in the market.
- Stochastic Oscillator: Both %K and %D lines have been in the overbought territory, suggesting a potential reversal in the stock price.
- Williams %R (Willams Percentage Range): The Williams %R has been in the oversold region, indicating a possible buying opportunity.
Volatility Analysis:
- Bollinger Bands: The stock price has been trading within the Bollinger Bands, with the bands narrowing, indicating reduced volatility.
- Bollinger %B: The %B indicator has been hovering around the middle line, suggesting a balanced market sentiment.
Volume Analysis:
- On-Balance Volume (OBV): The OBV has been decreasing, indicating selling pressure in the market.
- Chaikin Money Flow (CMF): The CMF has been negative, suggesting outflow of money from the stock.
Key Observations:
- The stock is currently in a downtrend based on Moving Averages and MACD indicators.
- Momentum indicators like RSI and Stochastic Oscillator suggest mixed signals with no clear trend direction.
- Volatility is decreasing, indicating a possible period of consolidation.
- Volume indicators show selling pressure with negative OBV and CMF values.
Conclusion:
Based on the analysis of technical indicators, the next few days' possible stock price movement is likely to be sideways with a bearish bias. The stock may continue to consolidate within a narrow range with a potential downside bias due to the prevailing downtrend indicated by Moving Averages and MACD. Traders should exercise caution and consider waiting for clearer signals before making any significant trading decisions.