Technical Analysis of HOMZ 2024-05-10
Overview:
In analyzing the technical indicators for HOMZ over the last 5 days, we will delve into the trend, momentum, volatility, and volume indicators to provide a comprehensive outlook on the possible stock price movement. By examining these key aspects, we aim to offer valuable insights and predictions for the upcoming days.
Trend Analysis:
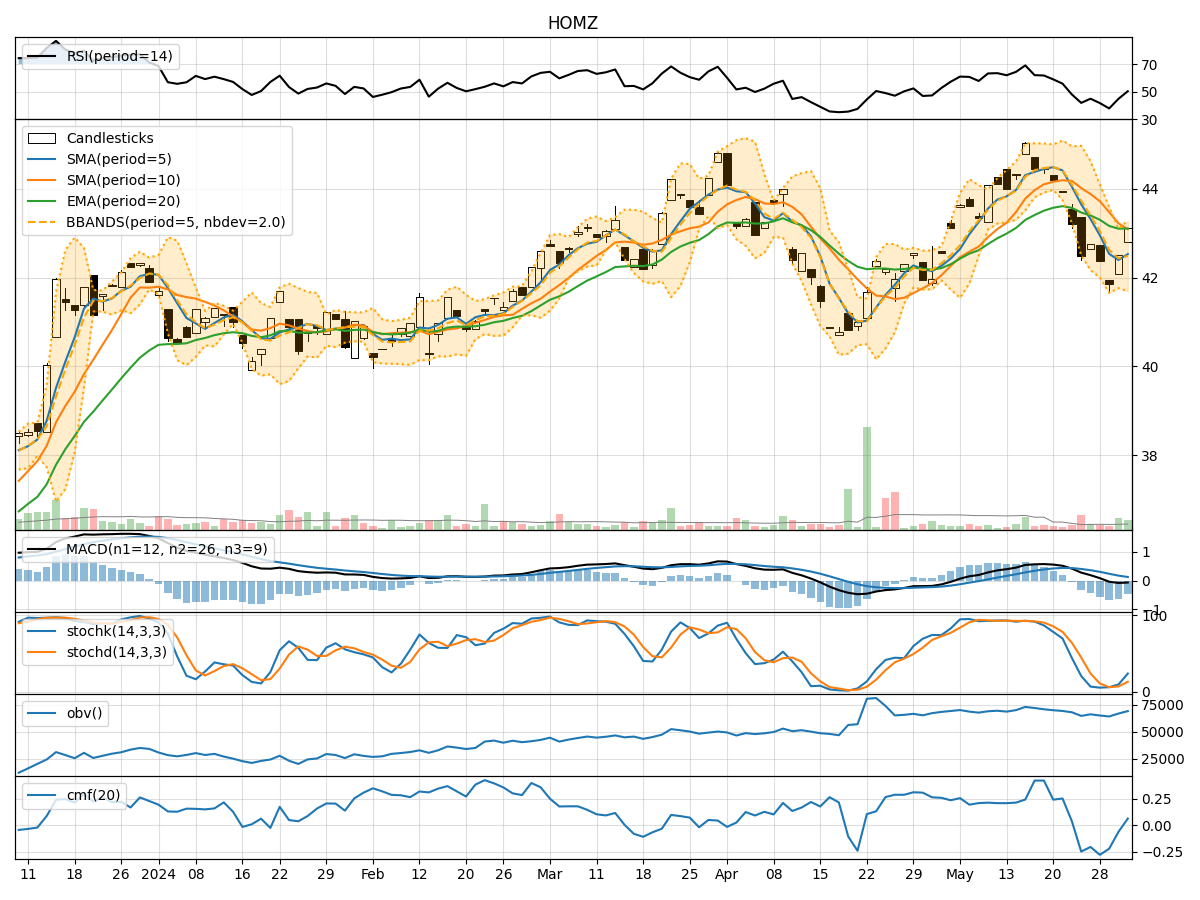
- Moving Averages (MA): The 5-day Moving Average (MA) has been consistently above the Simple Moving Average (SMA) and Exponential Moving Average (EMA), indicating a bullish trend.
- MACD: The MACD line has been consistently above the signal line, with positive values, suggesting a bullish momentum.
Key Observation: The trend indicators point towards a bullish sentiment in the stock price movement.
Momentum Analysis:
- RSI: The Relative Strength Index (RSI) has been fluctuating around the 60-65 range, indicating a neutral momentum.
- Stochastic Oscillator: Both %K and %D have been hovering around the overbought zone, suggesting a potential reversal.
Key Observation: The momentum indicators suggest a neutral to slightly bearish momentum in the stock.
Volatility Analysis:
- Bollinger Bands (BB): The stock price has been trading within the Bollinger Bands, with the bands narrowing, indicating decreasing volatility.
Key Observation: Volatility indicators signal a consolidation phase in the stock price movement.
Volume Analysis:
- On-Balance Volume (OBV): The OBV has shown a slight increase over the last 5 days, indicating accumulation.
- Chaikin Money Flow (CMF): The CMF has been positive, suggesting buying pressure in the stock.
Key Observation: Volume indicators reflect positive accumulation and buying pressure in the stock.
Conclusion:
Based on the analysis of the technical indicators, the next few days' possible stock price movement for HOMZ is as follows: - The trend indicators suggest a bullish sentiment. - Momentum indicators indicate a neutral to slightly bearish momentum. - Volatility indicators point towards a consolidation phase. - Volume indicators reflect positive accumulation and buying pressure.
Overall Assessment:
Considering the bullish trend, neutral to slightly bearish momentum, consolidation in volatility, and positive accumulation in volume, the stock price of HOMZ is likely to experience upward movement in the next few days. Traders may consider entering long positions with caution, keeping an eye on potential reversal signals from the momentum indicators.