Technical Analysis of HQGO 2024-05-10
Overview:
In analyzing the technical indicators for HQGO stock over the last 5 days, we will delve into the trend, momentum, volatility, and volume indicators to provide a comprehensive outlook on the possible future stock price movement. By examining these key aspects, we aim to offer valuable insights and predictions for the upcoming trading days.
Trend Indicators:
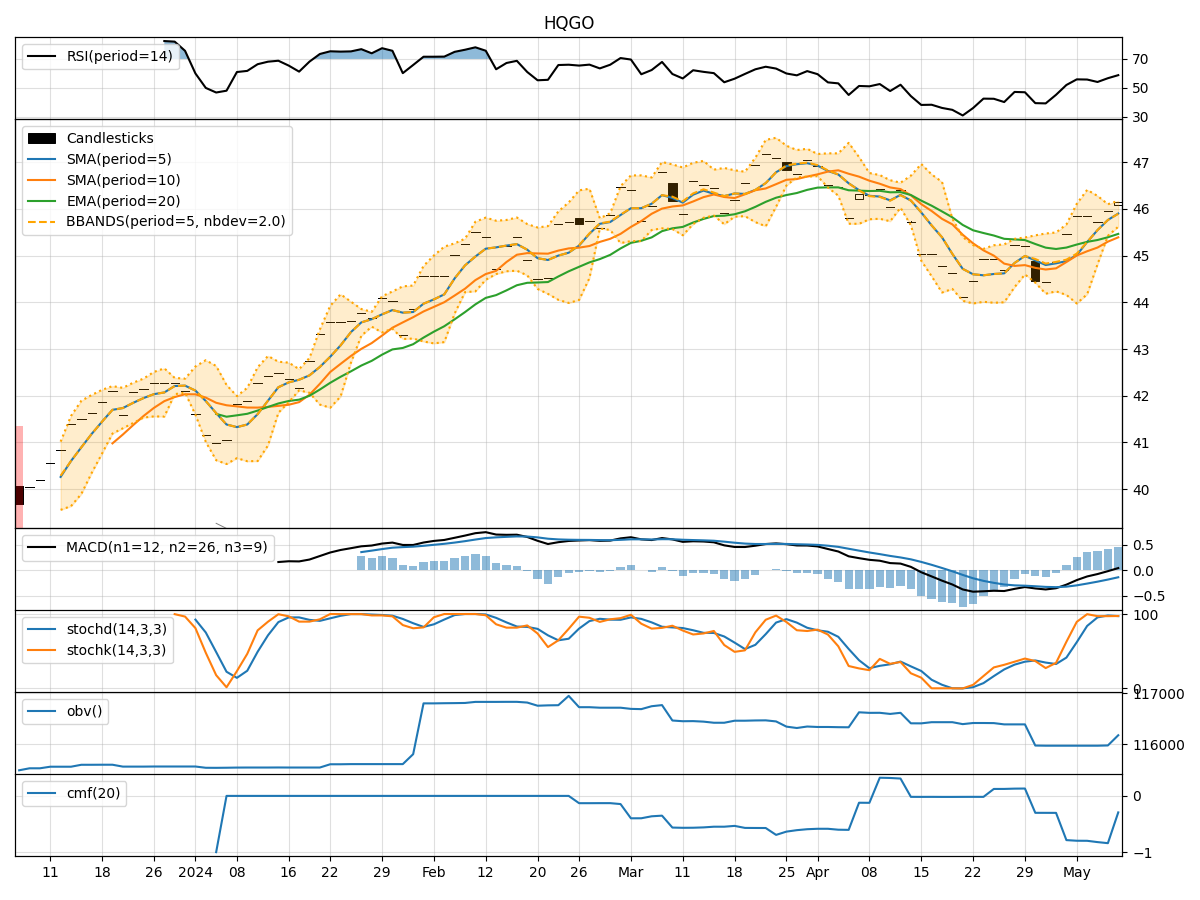
- Moving Averages (MA): The 5-day moving average has been steadily increasing, indicating a positive trend in the stock price.
- MACD: The MACD line has been consistently above the signal line, suggesting bullish momentum.
- RSI: The Relative Strength Index has been fluctuating around the neutral zone, indicating a balanced market sentiment.
Momentum Indicators:
- Stochastic Oscillator: Both %K and %D have been hovering in the overbought territory, signaling a potential reversal or consolidation.
- Williams %R: The Williams %R is close to the oversold region, indicating a possible buying opportunity.
Volatility Indicators:
- Bollinger Bands: The stock price has been trading within the bands, suggesting a period of consolidation.
- Average True Range (ATR): The ATR has been relatively stable, indicating consistent price movements.
Volume Indicators:
- On-Balance Volume (OBV): The OBV has been declining, indicating selling pressure in the stock.
- Chaikin Money Flow (CMF): The CMF has been negative, reflecting a lack of buying interest.
Key Observations:
- The trend indicators show a positive momentum in the stock price, supported by the MACD and moving averages.
- Momentum indicators suggest a potential reversal or consolidation phase due to overbought conditions in the stochastic oscillator.
- Volatility indicators point towards a period of consolidation as the stock price remains within the Bollinger Bands.
- Volume indicators indicate a bearish sentiment with declining OBV and negative CMF values.
Conclusion:
Based on the analysis of the technical indicators, the next few days for HQGO stock are likely to see sideways movement or consolidation. The stock may experience a period of price stabilization as it consolidates within a range. Traders should exercise caution and wait for clearer signals before making significant trading decisions.