Technical Analysis of HRTS 2024-05-10
Overview:
In analyzing the technical indicators for HRTS over the last 5 days, we will delve into the trend, momentum, volatility, and volume indicators to provide a comprehensive assessment of the stock's potential price movement. By examining these key factors, we aim to offer valuable insights and predictions for the next few days.
Trend Indicators:
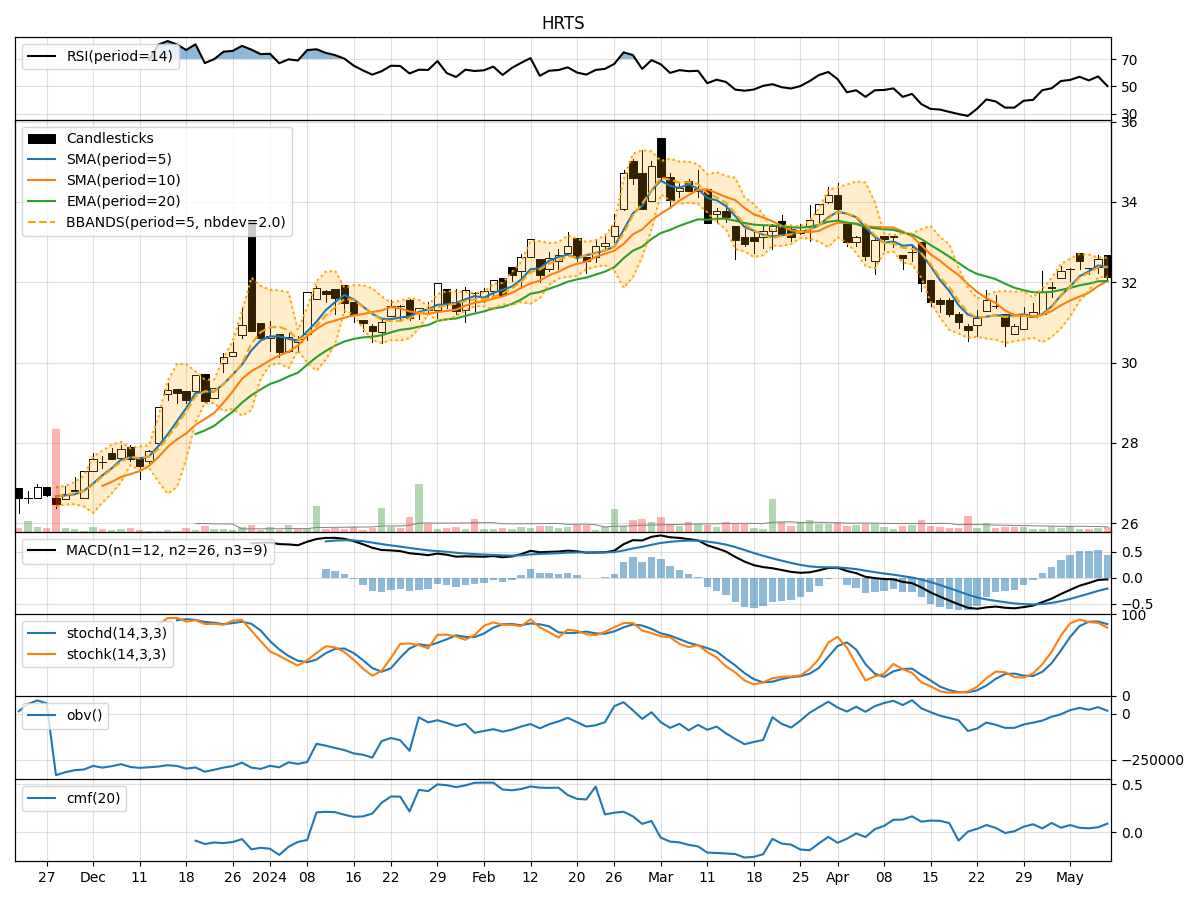
- Moving Averages (MA): The 5-day Moving Average (MA) has been consistently above the Simple Moving Average (SMA) and Exponential Moving Average (EMA), indicating a bullish trend.
- MACD: The MACD line has been consistently below the signal line, suggesting a bearish trend.
- Conclusion: The stock is currently in a bullish trend based on the Moving Averages but shows bearish signals according to the MACD indicator.
Momentum Indicators:
- RSI: The Relative Strength Index (RSI) has been fluctuating around the neutral level of 50, indicating indecision in the market.
- Stochastic Oscillator: Both %K and %D have been declining, signaling a potential bearish momentum.
- Conclusion: Momentum indicators suggest a neutral to bearish bias in the stock's price movement.
Volatility Indicators:
- Bollinger Bands: The stock price has been trading within the Bollinger Bands, with the bands narrowing, indicating decreasing volatility.
- Conclusion: Volatility is decreasing, suggesting a potential consolidation or sideways movement in the stock price.
Volume Indicators:
- On-Balance Volume (OBV): The OBV has been fluctuating, indicating mixed buying and selling pressure.
- Chaikin Money Flow (CMF): The CMF has been positive, suggesting some buying interest.
- Conclusion: Volume indicators show mixed signals with a slight bullish bias.
Overall Conclusion:
Based on the analysis of trend, momentum, volatility, and volume indicators, the next few days for HRTS are likely to see sideways movement or consolidation with a neutral to slightly bearish bias. Traders should exercise caution and closely monitor key support and resistance levels for potential entry or exit points.
Key Recommendations:
- Monitor Support and Resistance Levels: Keep a close eye on key support and resistance levels to gauge potential price movements.
- Wait for Confirmation: Wait for clear signals from technical indicators before making any trading decisions.
- Consider Risk Management: Implement proper risk management strategies to protect your capital in case of unexpected price fluctuations.
By combining technical analysis with prudent risk management, traders can navigate the market dynamics effectively and make informed decisions.