Technical Analysis of HSMV 2024-05-10
Overview:
In analyzing the technical indicators for HSMV stock over the last 5 days, we will delve into the trend, momentum, volatility, and volume indicators to provide a comprehensive outlook on the possible stock price movement in the coming days. By examining these key indicators, we aim to offer valuable insights and recommendations for potential investors.
Trend Indicators:
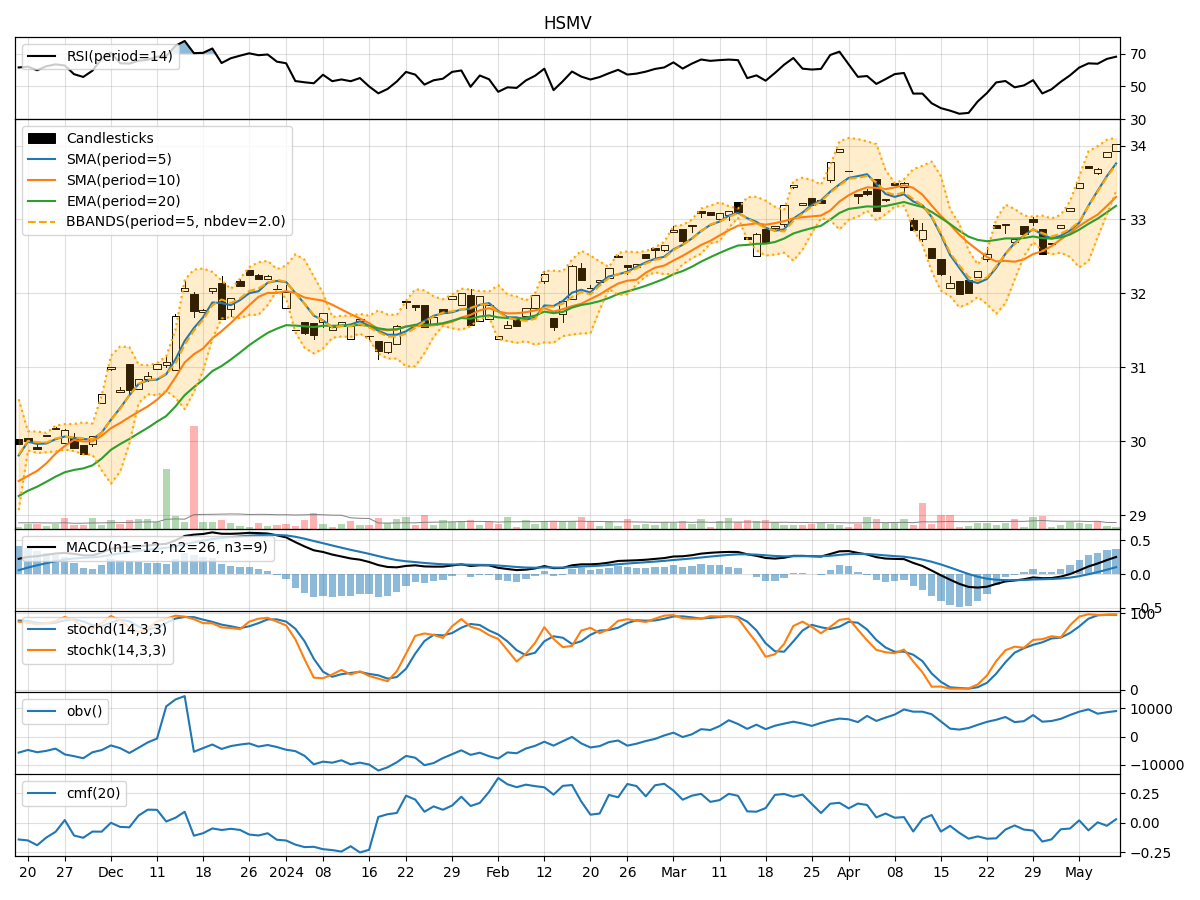
- Moving Averages (MA): The 5-day MA has been consistently above the closing prices, indicating a bullish trend.
- MACD: The MACD line has been consistently above the signal line, suggesting a bullish momentum.
- EMA: The EMA has been trending upwards, supporting the bullish sentiment in the short to medium term.
Momentum Indicators:
- RSI: The RSI has been in the overbought territory, indicating a strong bullish momentum.
- Stochastic Oscillator: Both %K and %D have been in the overbought zone, signaling a potential reversal or consolidation.
- Williams %R: The indicator has been in the oversold region, suggesting a possible reversal in the short term.
Volatility Indicators:
- Bollinger Bands (BB): The stock price has been trading within the bands, indicating moderate volatility.
- BB Width: The width of the bands has been narrowing, suggesting a potential decrease in volatility.
- BB %B: The %B indicator has been hovering around the middle, indicating a balanced market sentiment.
Volume Indicators:
- On-Balance Volume (OBV): The OBV has shown mixed signals, reflecting indecision among market participants.
- Chaikin Money Flow (CMF): The CMF has been fluctuating around the zero line, indicating a neutral stance on money flow.
Key Observations:
- The trend indicators suggest a strong bullish sentiment in the short to medium term.
- Momentum indicators indicate a potential overbought condition, signaling a need for caution.
- Volatility indicators point towards a decrease in volatility and a possible period of consolidation.
- Volume indicators show mixed signals, reflecting uncertainty among investors.
Conclusion:
Based on the analysis of the technical indicators, the stock price is likely to experience a period of consolidation in the coming days. While the trend remains bullish, the overbought momentum and decreasing volatility suggest a potential slowdown in price movement. Investors should closely monitor key support and resistance levels for potential entry or exit points. Exercise caution and consider waiting for clearer signals before making significant trading decisions.