Technical Analysis of HSUN 2024-05-10
Overview:
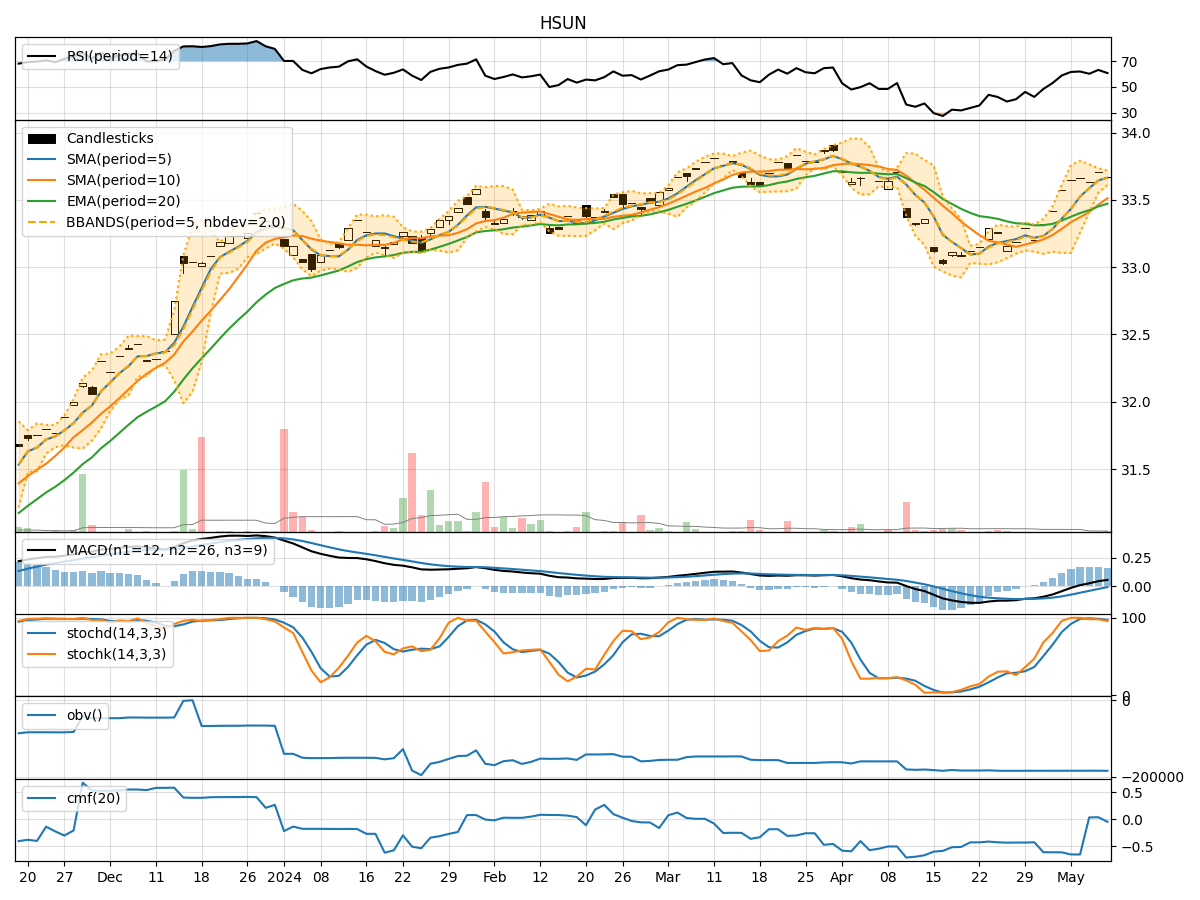
In analyzing the technical indicators for HSUN stock over the last 5 days, we will delve into the trends, momentum, volatility, and volume indicators to provide a comprehensive outlook on the possible future stock price movement. By examining key metrics such as moving averages, MACD, RSI, Bollinger Bands, and OBV, we aim to offer valuable insights and recommendations for potential trading strategies.
Trend Indicators:
- Moving Averages (MA): The 5-day MA has been consistently above the closing prices, indicating a short-term uptrend.
- MACD: The MACD line has been positive and above the signal line, suggesting bullish momentum.
- MACD Histogram: The histogram has been mostly positive, indicating increasing bullish momentum.
Momentum Indicators:
- RSI: The RSI has been fluctuating around the 60-63 range, suggesting moderate momentum without extreme overbought or oversold conditions.
- Stochastic Oscillator: Both %K and %D have been relatively high, indicating strong buying pressure.
- Williams %R: The indicator has been hovering around -6% to 0%, signaling a potential overbought condition.
Volatility Indicators:
- Bollinger Bands: The stock price has mostly stayed within the bands, with the %B indicator showing price nearing the upper band.
- Bollinger Band Width: The band width has been narrowing, indicating decreasing volatility.
- Bollinger Band %B: The %B has been above 0.5, suggesting a bullish sentiment.
Volume Indicators:
- On-Balance Volume (OBV): The OBV has shown mixed signals with slight fluctuations, indicating indecision in volume flow.
- Chaikin Money Flow (CMF): The CMF has been negative, reflecting selling pressure in the market.
Key Observations and Opinions:
- Trend: The stock is in an upward trend based on moving averages and MACD.
- Momentum: Momentum indicators suggest moderate bullish momentum but with signs of potential overbought conditions.
- Volatility: Bollinger Bands indicate low volatility and a potential breakout.
- Volume: Volume indicators show mixed signals with no clear direction.
Conclusion:
Based on the analysis of technical indicators, the next few days for HSUN stock could see further upside potential due to the overall bullish trend and momentum. However, caution is advised as some indicators suggest a potential overbought condition. Traders may consider taking profits or implementing tight stop-loss orders to manage risk. Overall, the outlook leans towards a bullish bias in the short term, but monitoring key levels and indicators is crucial for making informed trading decisions.