Technical Analysis of HTEC 2024-05-10
Overview:
In analyzing the technical indicators for HTEC over the last 5 days, we will delve into the trend, momentum, volatility, and volume indicators to provide a comprehensive outlook on the possible stock price movement in the coming days. By examining these key aspects, we aim to offer valuable insights and recommendations for potential investors.
Trend Analysis:
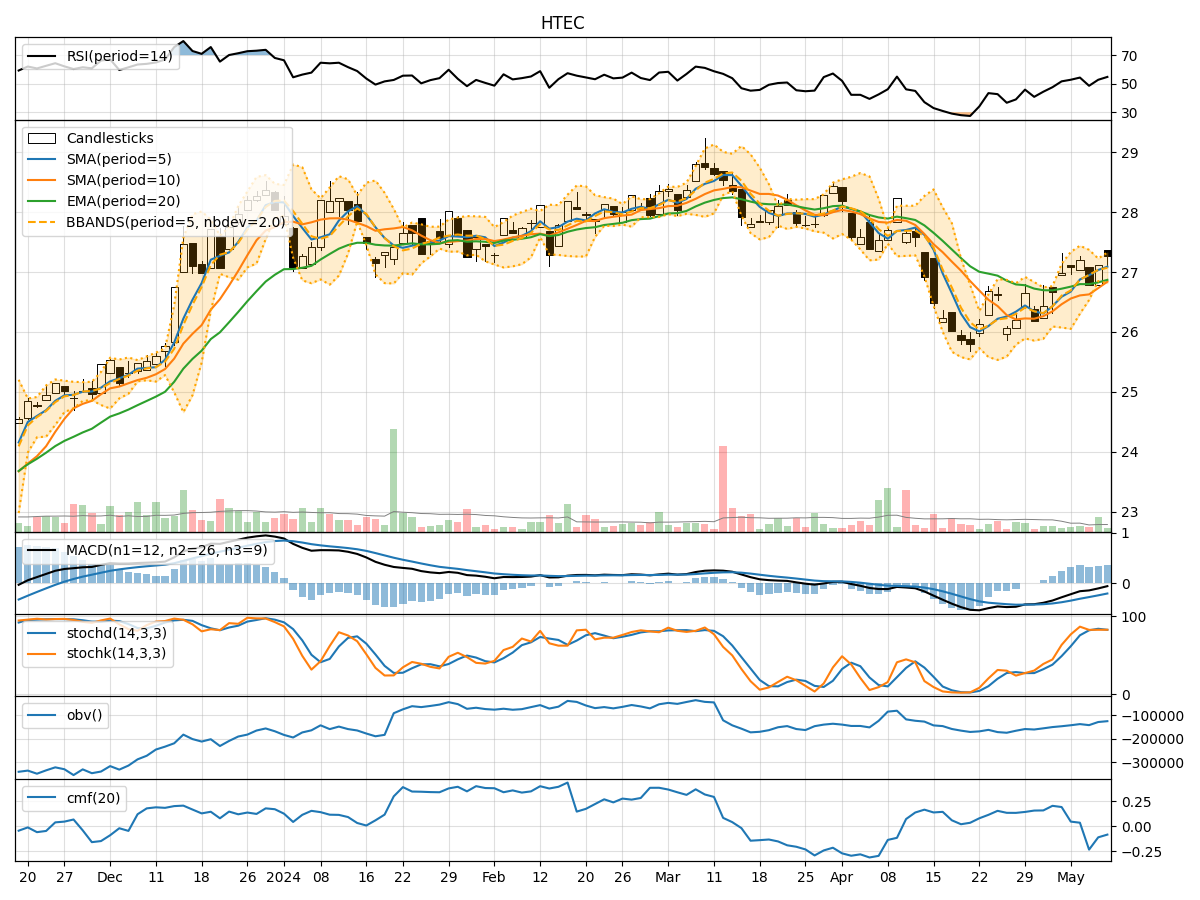
- Moving Averages (MA): The 5-day MA has been consistently above the 10-day SMA, indicating a short-term bullish trend. The EMA(20) has shown a slight upward trajectory, suggesting a positive momentum in the stock price.
- MACD: The MACD line has been above the signal line for the past few days, indicating a bullish trend. The MACD histogram has also been in positive territory, further supporting the bullish sentiment.
Momentum Analysis:
- RSI: The RSI has been fluctuating around the 50 level, indicating a neutral momentum in the stock price. There is no extreme overbought or oversold conditions based on RSI.
- Stochastic Oscillator: The stochastic indicators have been hovering in the overbought territory, suggesting a potential reversal or consolidation in the stock price.
Volatility Analysis:
- Bollinger Bands: The stock price has been trading within the Bollinger Bands, with no significant breaches outside the bands. This indicates a period of relative stability in price movement.
- Bollinger %B: The %B indicator has been fluctuating around the midline, signifying a balanced market sentiment without any extreme bullish or bearish signals.
Volume Analysis:
- On-Balance Volume (OBV): The OBV has shown a slight decline over the past few days, indicating a decrease in buying pressure. This could potentially lead to a consolidation or minor pullback in the stock price.
- Chaikin Money Flow (CMF): The CMF has been negative, suggesting a net outflow of money from the stock. This could signal a bearish sentiment among investors.
Conclusion:
Based on the analysis of the technical indicators, the stock of HTEC is likely to experience sideways movement or consolidation in the coming days. The trend indicators point towards a bullish bias, supported by the moving averages and MACD. However, the momentum indicators suggest a neutral stance with potential for a reversal in the overbought conditions. The volatility and volume indicators indicate a lack of significant price movements and a decrease in buying pressure, signaling a period of consolidation.
In conclusion, while the overall trend remains bullish, investors should exercise caution due to the neutral momentum and potential for consolidation. It is advisable to closely monitor key support and resistance levels for any potential breakout or reversal in the stock price.