Technical Analysis of HYBB 2024-05-10
Overview:
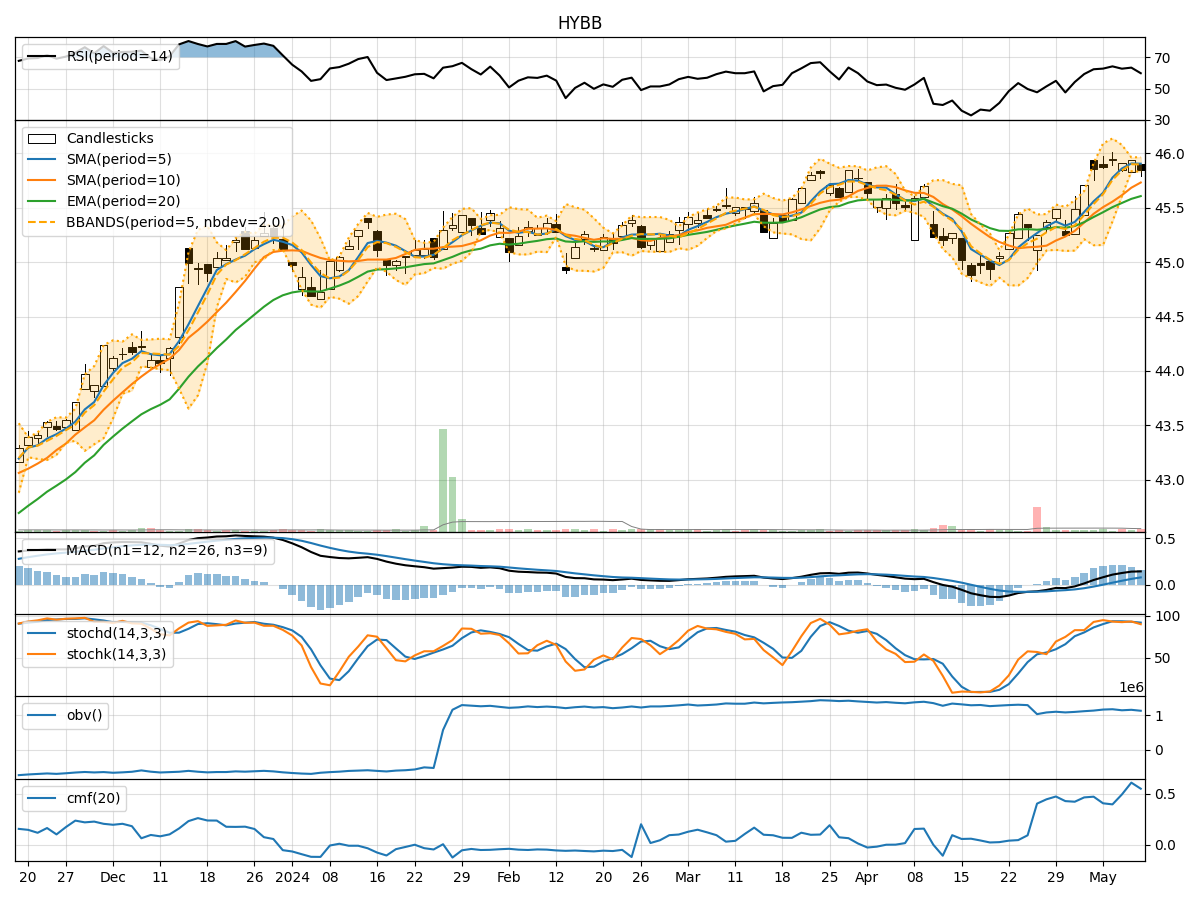
In analyzing the technical indicators for HYBB stock over the last 5 days, we will delve into the trend, momentum, volatility, and volume indicators to provide a comprehensive outlook on the possible stock price movement in the coming days. By examining these key indicators, we aim to offer valuable insights and recommendations for potential investors.
Trend Analysis:
- Moving Averages (MA): The 5-day Moving Average (MA) has been consistently above the Simple Moving Average (SMA) and Exponential Moving Average (EMA), indicating a bullish trend.
- MACD: The MACD line has been above the signal line, with both lines showing an upward trend, suggesting bullish momentum.
- RSI: The Relative Strength Index (RSI) has been fluctuating around the 60-65 range, indicating a neutral to slightly bullish sentiment.
Momentum Analysis:
- Stochastic Oscillator: The Stochastic Oscillator has been hovering in the overbought territory, suggesting a potential reversal or consolidation.
- Williams %R: The Williams %R indicator has been consistently in the oversold region, indicating a bearish sentiment.
Volatility Analysis:
- Bollinger Bands (BB): The stock price has been trading within the Bollinger Bands, with the bands narrowing, indicating decreasing volatility.
- Average True Range (ATR): The ATR has shown a decline, suggesting reduced price volatility.
Volume Analysis:
- On-Balance Volume (OBV): The OBV has been fluctuating, indicating indecision among investors.
- Chaikin Money Flow (CMF): The CMF has shown a slight increase, suggesting some buying pressure.
Key Observations:
- The trend indicators suggest a bullish sentiment, supported by the MACD and moving averages.
- Momentum indicators show conflicting signals, with the Stochastic Oscillator indicating overbought conditions and the Williams %R signaling oversold levels.
- Volatility has been decreasing, indicating a potential period of consolidation.
- Volume indicators reflect mixed investor sentiment, with OBV fluctuating and CMF showing a slight increase.
Conclusion:
Based on the analysis of the technical indicators, the stock price of HYBB is likely to experience a period of consolidation in the coming days. The bullish trend indicated by moving averages and MACD may face resistance due to overbought conditions highlighted by the Stochastic Oscillator. The decreasing volatility suggests a potential narrowing of price movements, while the mixed volume indicators indicate indecision among investors. Therefore, investors should exercise caution and closely monitor the price action for any potential breakout or reversal signals.