Technical Analysis of HYBL 2024-05-10
Overview:
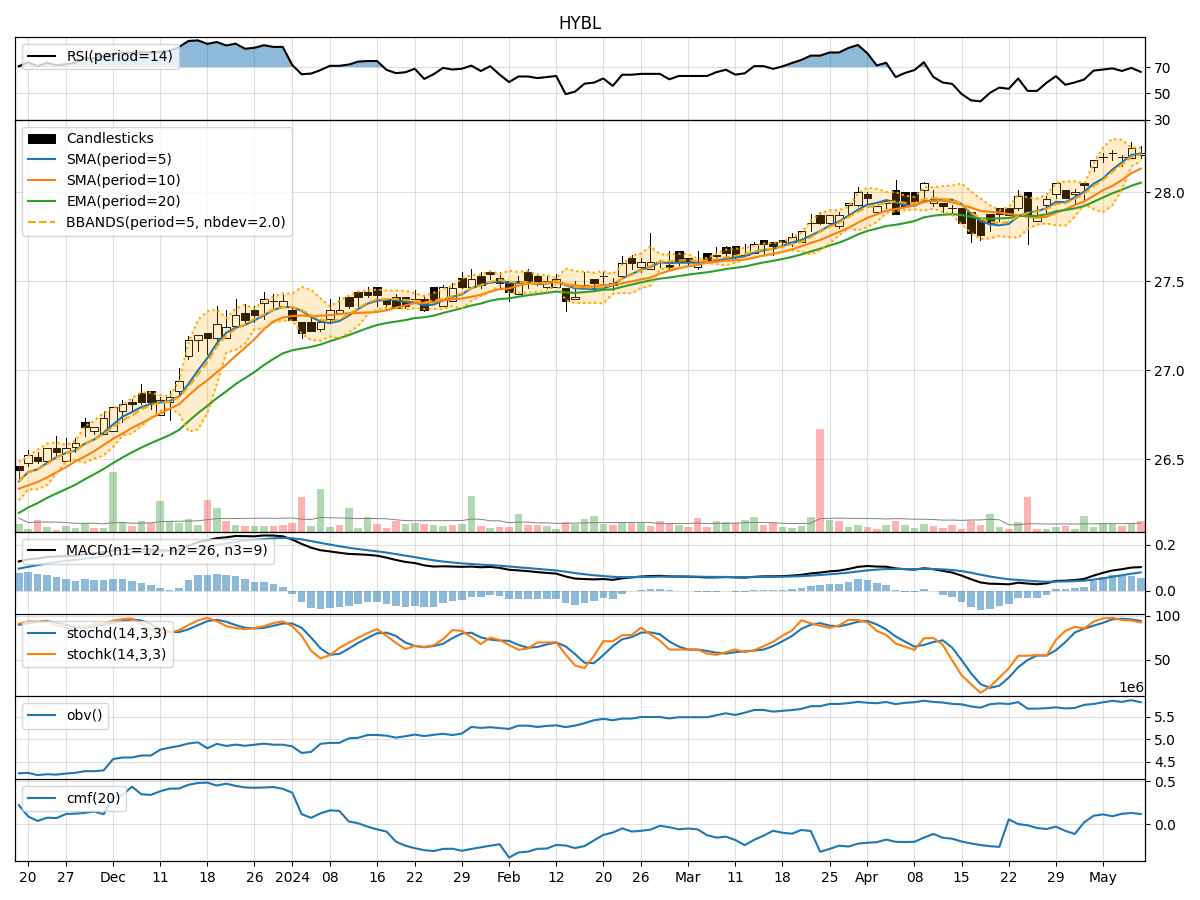
In analyzing the technical indicators for HYBL over the last 5 days, we will delve into the trend, momentum, volatility, and volume indicators to provide a comprehensive outlook on the possible stock price movement in the coming days. By examining these key indicators, we aim to offer valuable insights and predictions to guide investment decisions.
Trend Analysis:
- Moving Averages (MA): The 5-day MA has been consistently above the closing prices, indicating a short-term uptrend.
- MACD: The MACD line has been above the signal line, suggesting bullish momentum.
- Relative Strength Index (RSI): RSI values have been in the overbought territory, signaling a strong bullish sentiment.
Key Observation: The trend indicators point towards a bullish outlook for HYBL.
Momentum Analysis:
- Stochastic Oscillator: Both %K and %D values have been relatively high, indicating strong buying pressure.
- Williams %R (WillR): WillR values have been in the oversold region, suggesting a potential reversal.
Key Observation: Momentum indicators reflect a bullish sentiment with some signs of potential reversal.
Volatility Analysis:
- Bollinger Bands (BB): The stock price has mostly remained within the bands, indicating stability.
Key Observation: Volatility indicators suggest a sideways movement with no significant price fluctuations.
Volume Analysis:
- On-Balance Volume (OBV): The OBV has shown a slight increase, indicating accumulation.
- Chaikin Money Flow (CMF): CMF values have been positive, signaling buying pressure.
Key Observation: Volume indicators support a bullish sentiment with increasing accumulation.
Conclusion:
Based on the analysis of trend, momentum, volatility, and volume indicators, the overall outlook for HYBL in the next few days is bullish. The stock is likely to experience further upward movement supported by strong buying pressure, positive trend indicators, and increasing accumulation. Investors may consider taking long positions or holding onto existing positions to capitalize on the expected price appreciation.
Key Conclusion:
The technical analysis suggests a bullish trend for HYBL in the coming days, with potential for further price appreciation. Investors should monitor the indicators closely for any signs of reversal or consolidation.