Technical Analysis of HYDR 2024-05-10
Overview:
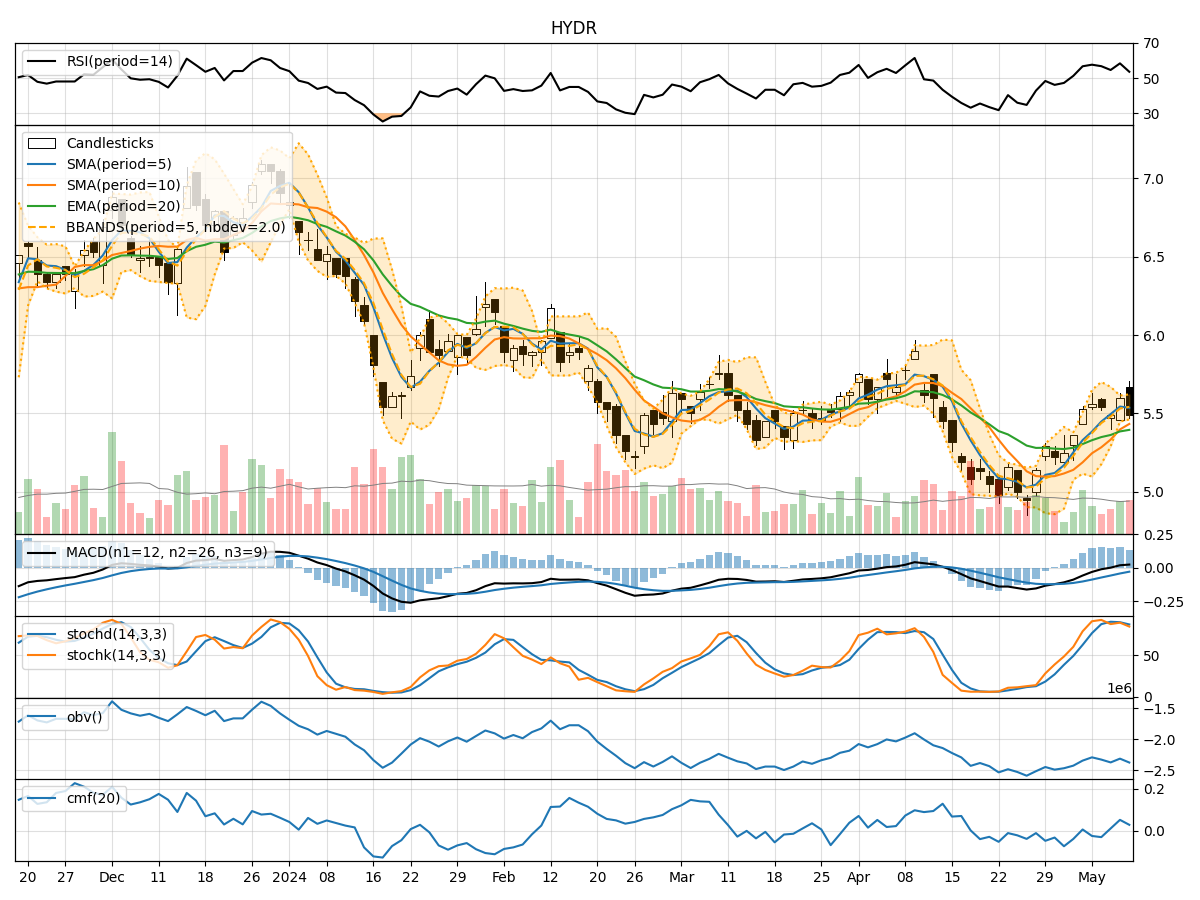
In analyzing the technical indicators for HYDR over the last 5 days, we will delve into the trend, momentum, volatility, and volume indicators to provide a comprehensive outlook on the possible stock price movement in the coming days. By examining these key indicators, we aim to offer valuable insights and predictions for potential investors.
Trend Indicators:
- Moving Averages (MA): The 5-day MA has been consistently above the closing prices, indicating a short-term uptrend.
- MACD: The MACD line has been positive, suggesting bullish momentum.
- MACD Histogram: The histogram has shown an increasing trend, indicating strengthening bullish momentum.
Key Observation: The trend indicators suggest a bullish sentiment in the short term.
Momentum Indicators:
- RSI: The RSI has been fluctuating around the 50 level, indicating a neutral momentum.
- Stochastic Oscillator: Both %K and %D have been fluctuating, showing indecision in momentum.
- Williams %R: The indicator has been in oversold territory, suggesting a potential reversal.
Key Observation: Momentum indicators are mixed, reflecting uncertainty in the stock's momentum.
Volatility Indicators:
- Bollinger Bands (BB): The stock price has been trading within the bands, indicating normal volatility.
- Bollinger %B: The %B has been fluctuating around the midline, suggesting balanced volatility.
Key Observation: Volatility indicators point towards stable price movements with no extreme fluctuations.
Volume Indicators:
- On-Balance Volume (OBV): The OBV has shown mixed movements, indicating indecision among investors.
- Chaikin Money Flow (CMF): The CMF has been positive, suggesting buying pressure in the stock.
Key Observation: Volume indicators reflect mixed sentiment among investors, with some buying interest evident.
Conclusion:
Based on the analysis of the technical indicators, the next few days' possible stock price movement for HYDR is likely to be sideways with a slight bullish bias. The trend indicators signal a short-term uptrend, while momentum indicators show mixed signals. Volatility indicators suggest stable price movements, and volume indicators indicate a mix of buying and selling pressure.
Overall, the stock is expected to consolidate in the near term with a potential for a slight upward movement. Investors should closely monitor key support and resistance levels for potential entry and exit points.
This analysis provides a balanced view considering the various technical aspects of the stock, offering insights for informed decision-making in the dynamic stock market environment.