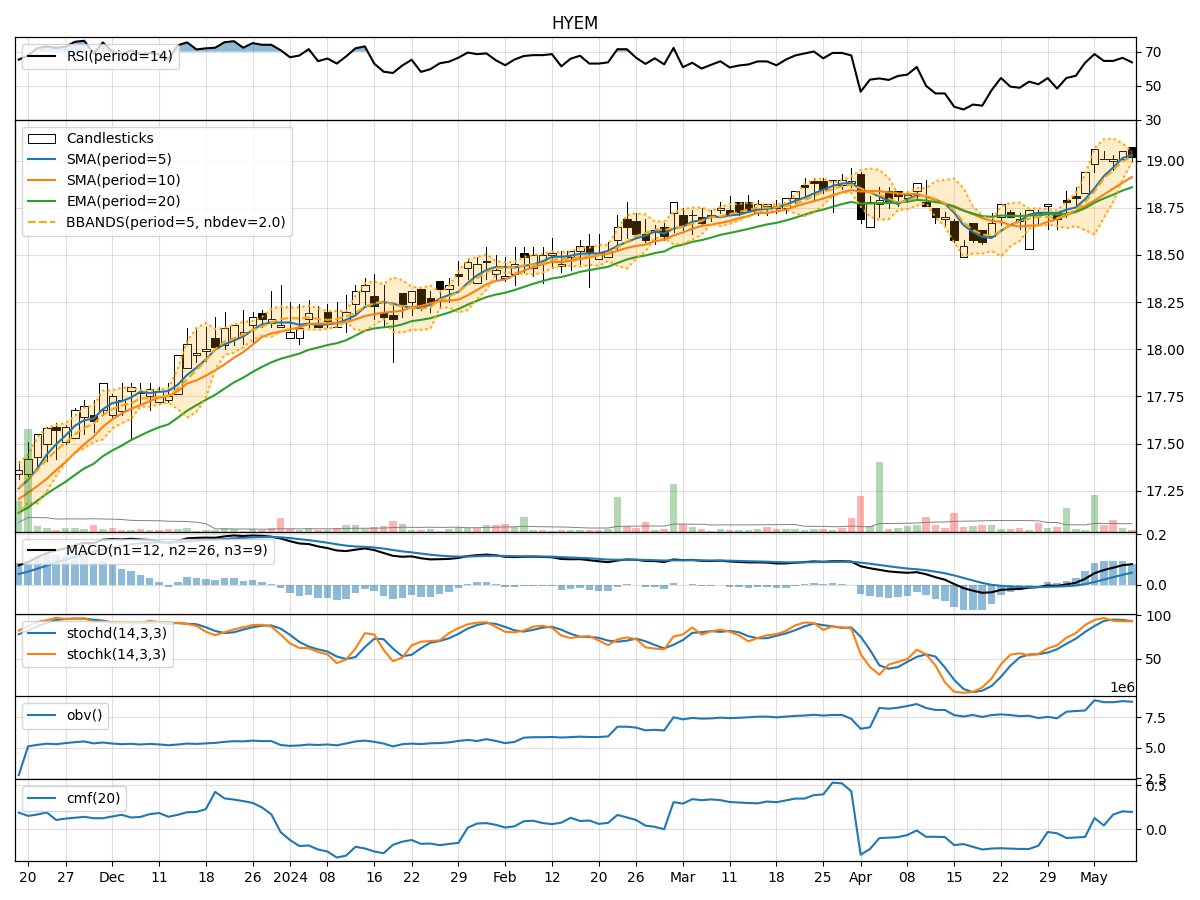
Technical Analysis of HYEM 2024-05-10
Overview:
In analyzing the technical indicators for HYEM over the last 5 days, we will delve into the trend, momentum, volatility, and volume indicators to provide a comprehensive outlook on the possible stock price movement in the coming days. By examining these key aspects, we aim to offer valuable insights and predictions for informed decision-making.
Trend Indicators:
- Moving Averages (MA): The 5-day MA has been consistently above the 10-day SMA, indicating a short-term bullish trend.
- MACD: The MACD line has been consistently above the signal line, suggesting upward momentum.
- RSI: The RSI values have been in the range of 60-70, indicating a neutral to slightly bullish sentiment.
Momentum Indicators:
- Stochastic Oscillator: The Stochastics have been in the overbought zone, suggesting a potential reversal or consolidation.
- Williams %R: The Williams %R values have been fluctuating around the oversold territory, indicating a mixed sentiment.
Volatility Indicators:
- Bollinger Bands (BB): The price has been trading within the bands, with the bands narrowing, indicating reduced volatility.
- Average True Range (ATR): The ATR values have been relatively stable, suggesting consistent price movements.
Volume Indicators:
- On-Balance Volume (OBV): The OBV has shown a slight increase, indicating some buying pressure.
- Chaikin Money Flow (CMF): The CMF values have been positive, reflecting accumulation in the stock.
Key Observations:
- The trend indicators suggest a bullish bias in the short term.
- Momentum indicators show signs of potential reversal or consolidation.
- Volatility indicators point towards reduced price fluctuations.
- Volume indicators indicate some buying interest in the stock.
Conclusion:
Based on the analysis of the technical indicators, the stock price of HYEM is likely to experience further upward movement in the coming days. The bullish trend supported by moving averages and MACD, coupled with positive volume indicators, indicates a favorable outlook. However, caution is advised as momentum indicators signal a potential reversal or consolidation. Traders should closely monitor the Stochastic Oscillator and Williams %R for any shifts in sentiment. Overall, the bullish view is supported by the majority of technical indicators, suggesting a positive trajectory for HYEM in the near term.