Technical Analysis of HYGH 2024-05-10
Overview:
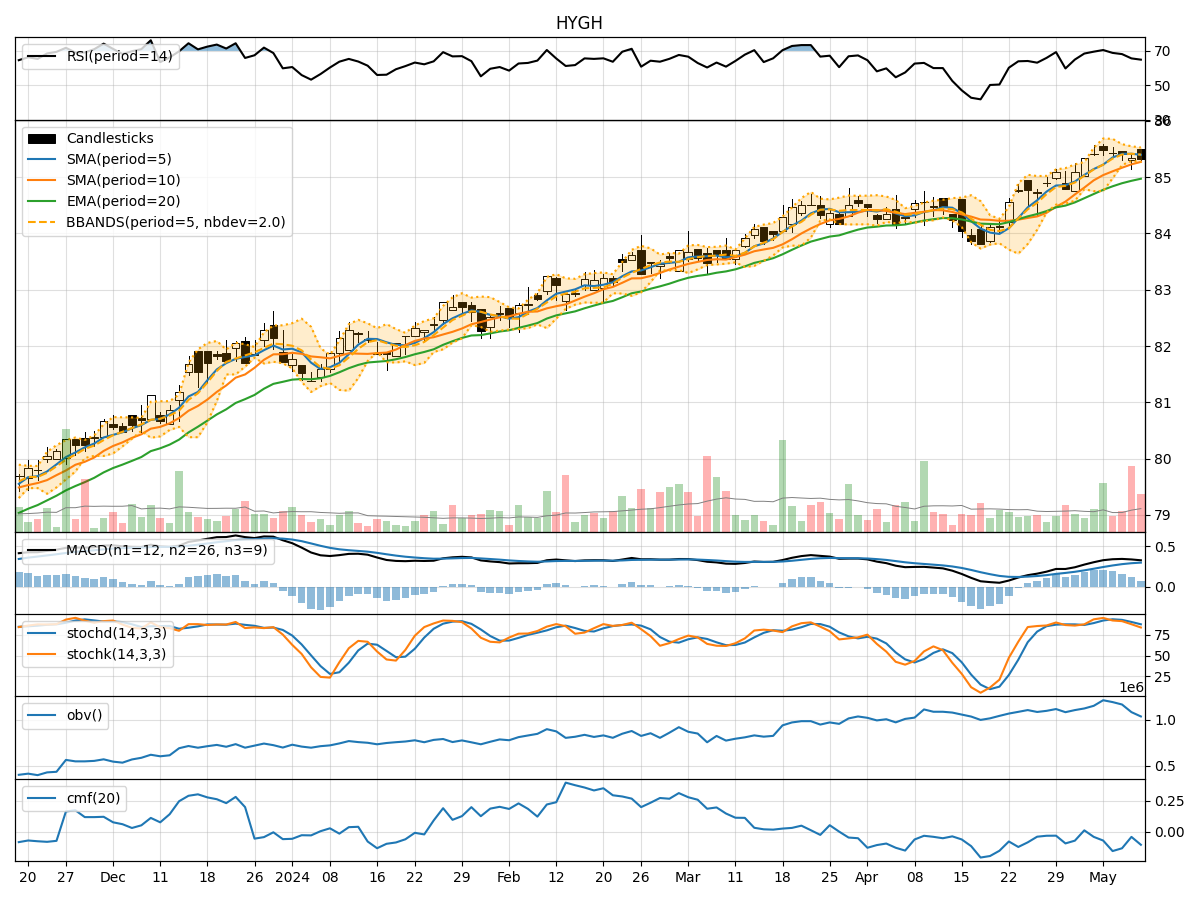
In analyzing the technical indicators for HYGH stock over the last 5 days, we will delve into the trends, momentum, volatility, and volume aspects to provide a comprehensive outlook on the possible stock price movement in the coming days. By examining key indicators such as moving averages, MACD, RSI, Bollinger Bands, and OBV, we aim to offer valuable insights and predictions for potential price action.
Trend Analysis:
- Moving Averages (MA): The 5-day moving average has been consistently above the simple moving average (SMA) and exponential moving average (EMA), indicating a bullish trend.
- MACD: The MACD line has been above the signal line, with both lines showing an upward trend, suggesting bullish momentum.
Momentum Analysis:
- RSI: The Relative Strength Index (RSI) has been gradually decreasing but remains above the oversold threshold of 30, indicating a potential consolidation phase.
- Stochastic Oscillator: Both %K and %D have been declining, moving towards the oversold region, signaling a possible reversal or consolidation.
Volatility Analysis:
- Bollinger Bands (BB): The stock price has been trading within the bands, with the bands narrowing, suggesting reduced volatility and a potential breakout in the near future.
Volume Analysis:
- On-Balance Volume (OBV): The OBV has been declining, indicating a decrease in buying pressure and potential distribution.
Key Observations:
- The stock is currently in a bullish trend based on moving averages and MACD.
- Momentum indicators suggest a possible consolidation or reversal in the short term.
- Volatility is decreasing, indicating a potential breakout.
- Volume has been declining, signaling weakening buying pressure.
Conclusion:
Based on the analysis of technical indicators, the next few days' possible stock price movement for HYGH is likely to be sideways with a slight bearish bias. The stock may consolidate within a range as momentum weakens and volatility decreases. Traders should watch for a potential breakout from the Bollinger Bands and monitor volume for any signs of renewed buying interest. It is advisable to exercise caution and wait for clearer signals before making significant trading decisions.