Technical Analysis of HYGI 2024-05-10
Overview:
In analyzing the technical indicators for HYGI stock over the last 5 days, we will delve into the trends, momentum, volatility, and volume indicators to provide a comprehensive outlook on the possible stock price movement in the coming days. By examining these key indicators, we aim to offer valuable insights and predictions for potential investors.
Trend Indicators:
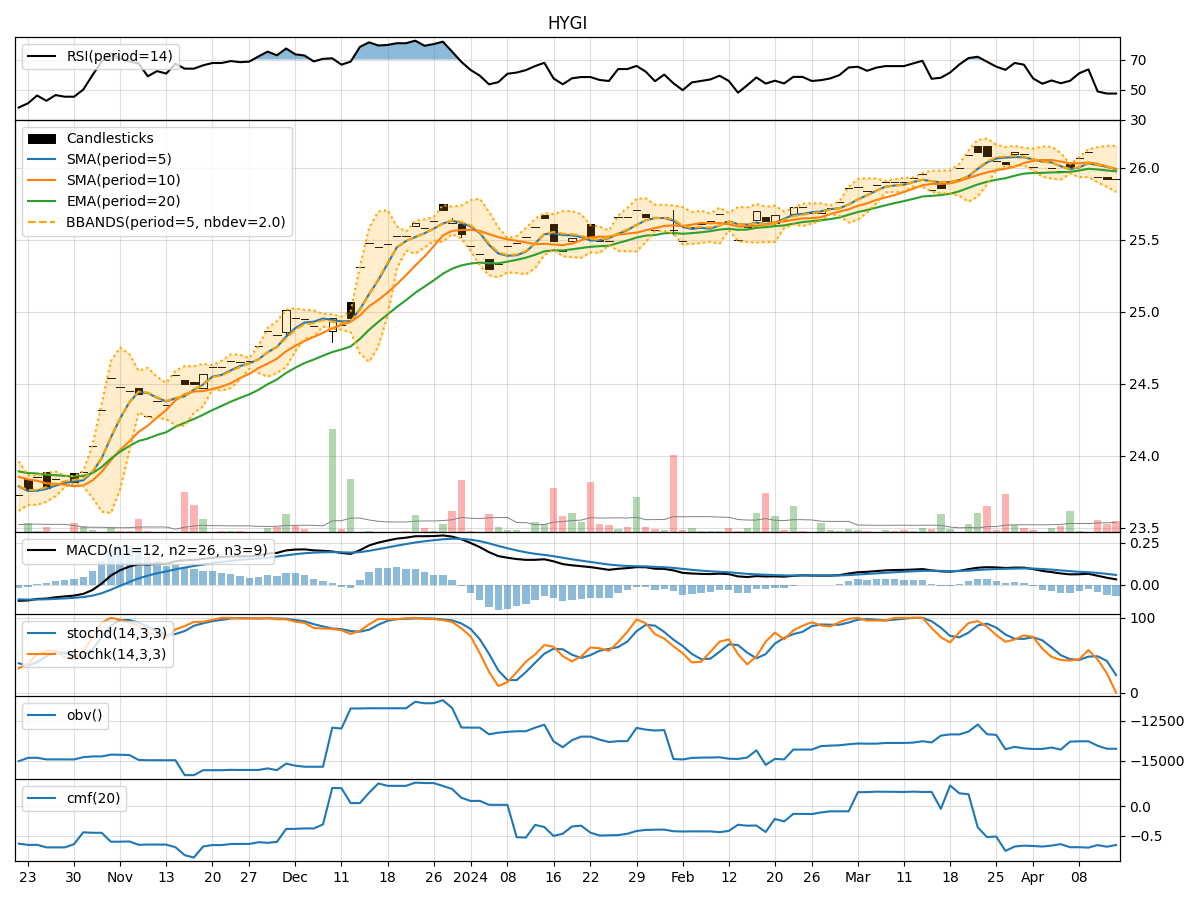
- Moving Averages (MA): The 5-day MA has been consistently above the 10-day SMA, indicating a short-term bullish trend. The EMA(20) has shown a gradual uptrend, suggesting positive momentum in the stock price.
- MACD: The MACD line has been above the signal line for the past 5 days, indicating a bullish trend. The MACD histogram has also been increasing, reflecting strengthening bullish momentum.
Momentum Indicators:
- RSI: The RSI has been fluctuating around the 60-65 range, indicating a neutral to slightly bullish momentum. It has not reached overbought levels, suggesting room for potential upside.
- Stochastic Oscillator: Both %K and %D have been gradually decreasing but remain in the overbought territory. This could signal a potential reversal or consolidation in the stock price.
- Williams %R: The Williams %R has been in the oversold region, indicating a potential buying opportunity. However, it has not shown a clear reversal signal yet.
Volatility Indicators:
- Bollinger Bands: The stock price has been trading within the Bollinger Bands, with the bands narrowing over the past few days. This could indicate a period of consolidation or reduced volatility.
- Bollinger %B: The %B indicator has been hovering around the midpoint, suggesting a balanced market sentiment without any extreme bullish or bearish signals.
Volume Indicators:
- On-Balance Volume (OBV): The OBV has shown mixed signals, with fluctuations in volume but no clear trend. This could indicate indecision among market participants.
- Chaikin Money Flow (CMF): The CMF has been positive but decreasing, indicating that money flow into the stock is slowing down. This could signal a potential weakening of buying pressure.
Conclusion:
Based on the analysis of the technical indicators, the stock price of HYGI is likely to experience sideways movement or consolidation in the coming days. The trend indicators suggest a bullish bias, supported by the MACD and moving averages. However, momentum indicators like the Stochastic Oscillator and Williams %R indicate a potential reversal or consolidation. Volatility indicators point towards a period of reduced volatility, while volume indicators show mixed signals.
In conclusion, while there may be short-term fluctuations, the overall outlook for HYGI stock is neutral with a slight bullish bias. Investors should closely monitor key support and resistance levels for potential entry or exit points.