Technical Analysis of HYGV 2024-05-10
Overview:
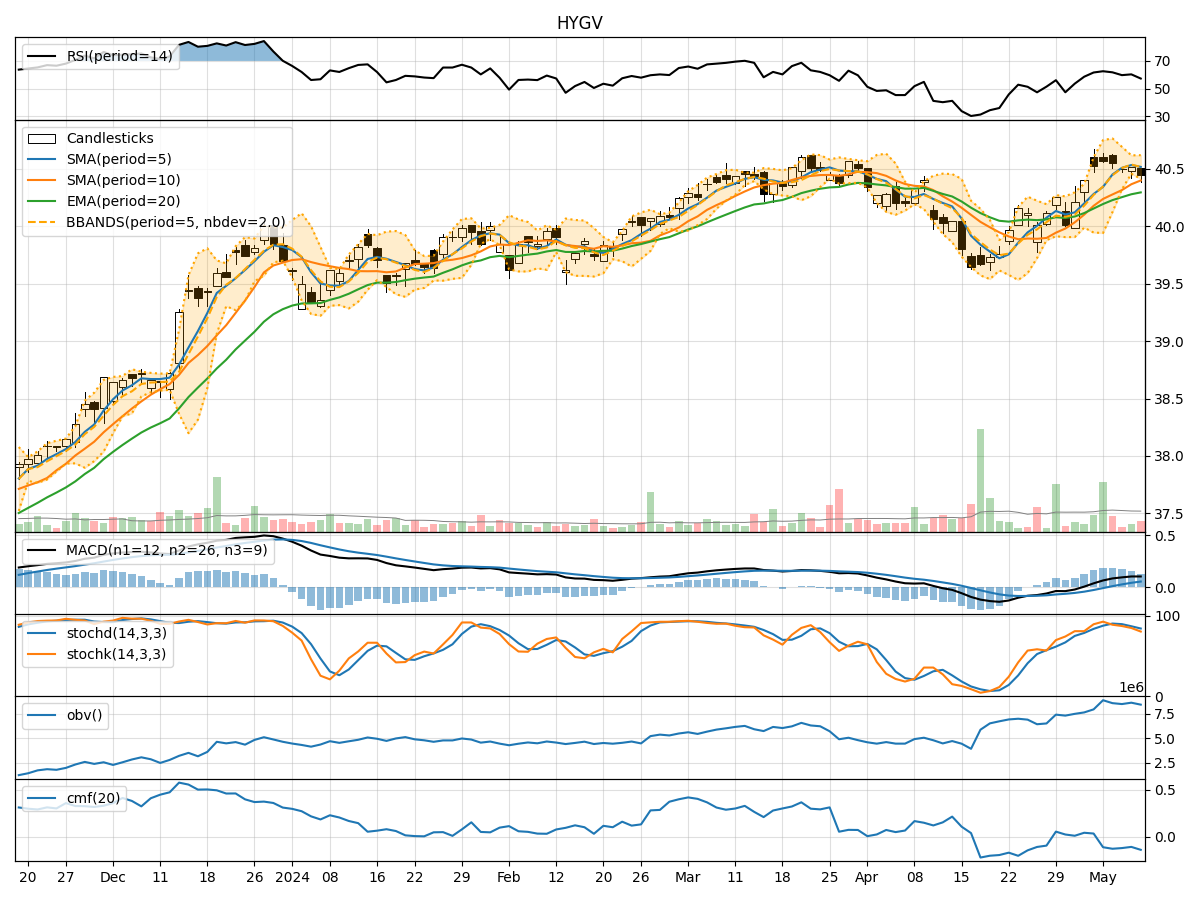
In analyzing the technical indicators for HYGV over the last 5 days, we will delve into the trend, momentum, volatility, and volume indicators to provide a comprehensive outlook on the possible stock price movement. By examining these key indicators, we aim to offer valuable insights and predictions for the upcoming days.
Trend Indicators:
- Moving Averages (MA): The 5-day MA has been consistently above the closing price, indicating a short-term uptrend.
- MACD: The MACD line has been positive and increasing, suggesting bullish momentum.
- MACD Histogram: The histogram has been rising, indicating strengthening bullish momentum.
Key Observation: The trend indicators point towards a bullish sentiment in the short term.
Momentum Indicators:
- RSI: The RSI has been fluctuating around the 60 level, indicating a neutral momentum.
- Stochastic Oscillator: Both %K and %D have been declining, signaling a potential bearish momentum.
- Williams %R: The indicator has been in oversold territory, suggesting a possible reversal.
Key Observation: Momentum indicators are mixed, with a slight bearish bias emerging.
Volatility Indicators:
- Bollinger Bands: The bands have been narrowing, indicating decreasing volatility.
- Bollinger %B: The %B indicator has been hovering around the midline, suggesting a balanced market sentiment.
Key Observation: Volatility is decreasing, potentially leading to a period of consolidation.
Volume Indicators:
- On-Balance Volume (OBV): The OBV has been relatively flat, indicating a balance between buying and selling pressure.
- Chaikin Money Flow (CMF): The CMF has been negative, suggesting outflows from the stock.
Key Observation: Volume indicators reflect a lack of strong buying or selling pressure.
Conclusion:
Based on the analysis of the technical indicators, the next few days for HYGV could see sideways movement with a slight bearish bias. The trend indicators suggest a bullish sentiment in the short term, but the momentum indicators show signs of potential bearish momentum. Volatility is decreasing, indicating a period of consolidation, while volume indicators point to a balanced market sentiment with no clear direction.
Key Conclusion: Expect sideways movement with a slight bearish bias in the next few days for HYGV.