Technical Analysis of HYKE 2024-05-10
Overview:
In analyzing the technical indicators for HYKE stock over the last 5 days, we will delve into the trend, momentum, volatility, and volume indicators to provide a comprehensive outlook on the possible stock price movement in the coming days. By examining key metrics such as moving averages, MACD, RSI, Bollinger Bands, and OBV, we aim to offer valuable insights and predictions for potential price action.
Trend Indicators:
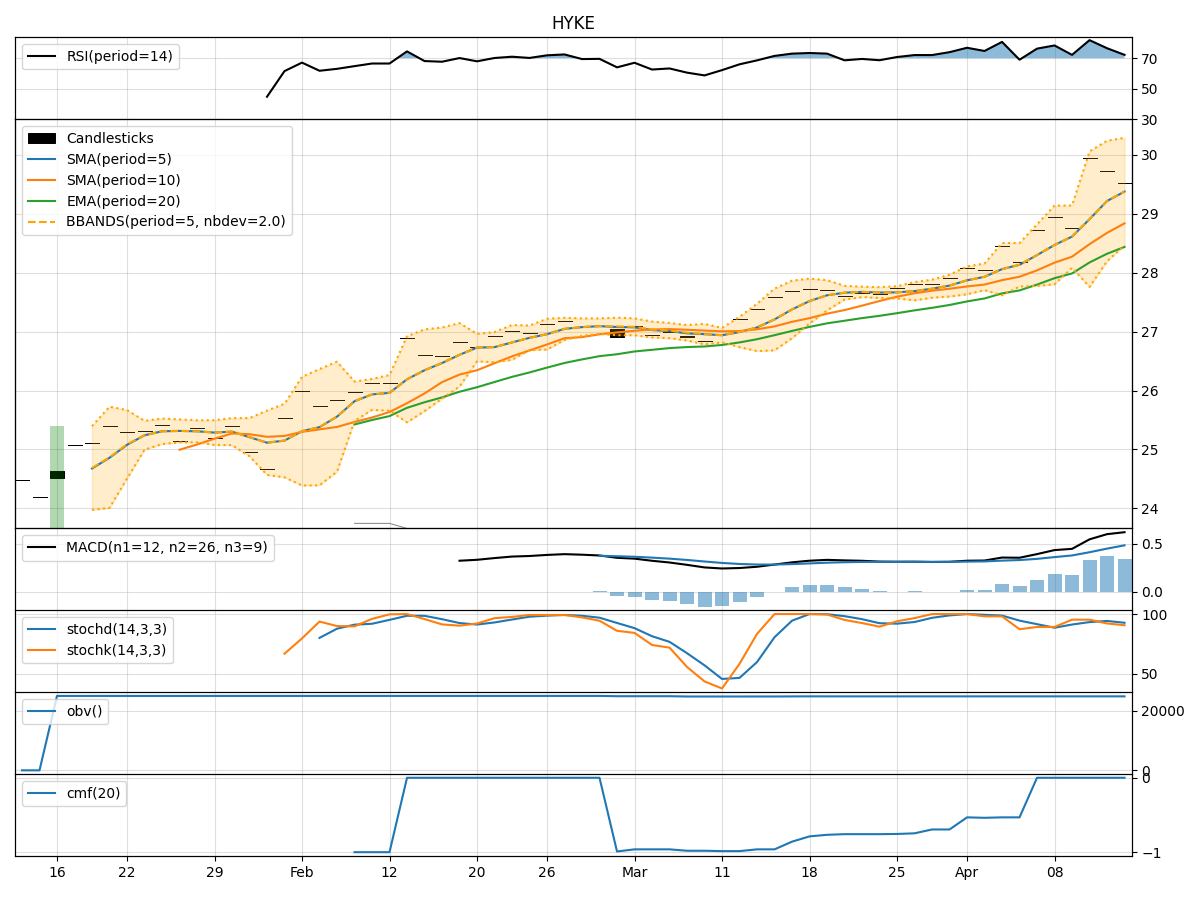
- Moving Averages (MA): The 5-day MA has been fluctuating around the actual closing prices, indicating a lack of strong trend direction.
- MACD: The MACD line has been positive but decreasing, while the MACD Histogram has been fluctuating around the zero line, suggesting a weakening bullish momentum.
- Conclusion: The trend indicators show a neutral stance with a slight bearish bias due to the weakening momentum.
Momentum Indicators:
- RSI: The RSI has been hovering around the mid-level, indicating a balanced momentum between buying and selling pressure.
- Stochastic Oscillator: Both %K and %D have been relatively low, suggesting a lack of strong momentum.
- Conclusion: Momentum indicators reflect a sideways movement with no clear direction, indicating a consolidation phase.
Volatility Indicators:
- Bollinger Bands (BB): The stock price has been trading within the bands, with the %B indicator showing fluctuations but staying within the normal range.
- Conclusion: Volatility indicators suggest a stable price movement within the bands, indicating a sideways trend with no extreme price fluctuations.
Volume Indicators:
- On-Balance Volume (OBV): The OBV has been slightly negative, indicating a minor distribution phase.
- Chaikin Money Flow (CMF): The CMF has been consistently at zero, signaling a balance between buying and selling pressure.
- Conclusion: Volume indicators point towards a neutral volume flow with no significant accumulation or distribution signals.
Overall Conclusion:
Based on the analysis of the technical indicators, the next few days for HYKE stock are likely to see a sideways movement with a slight bearish bias. The lack of strong trends in the trend and momentum indicators, coupled with stable volatility and neutral volume flow, suggests a period of consolidation with no clear direction. Traders and investors should exercise caution and wait for stronger signals before making significant trading decisions.
Key Takeaways:
- Trend: Neutral with a slight bearish bias.
- Momentum: Sideways with no clear direction.
- Volatility: Stable within Bollinger Bands.
- Volume: Neutral with minor distribution signals.
Recommendation:
Given the current market dynamics and technical indicators, it is advisable to wait for clearer signals before taking any significant positions. Traders may consider implementing range-bound strategies or setting tight stop-loss levels to manage risk effectively. Long-term investors should monitor the situation closely for potential entry points during more decisive price movements.
Disclaimer:
Remember that technical analysis is not foolproof and should be used in conjunction with other forms of analysis. Market conditions can change rapidly, so it is essential to stay informed and adapt your strategies accordingly. Consulting with a financial advisor or conducting further research is always recommended before making investment decisions.