Technical Analysis of HYLB 2024-05-10
Overview:
In analyzing the technical indicators for HYLB over the last 5 days, we will delve into the trend, momentum, volatility, and volume indicators to provide a comprehensive outlook on the possible stock price movement in the coming days. By examining these key aspects, we aim to offer valuable insights and recommendations for potential investors.
Trend Analysis:
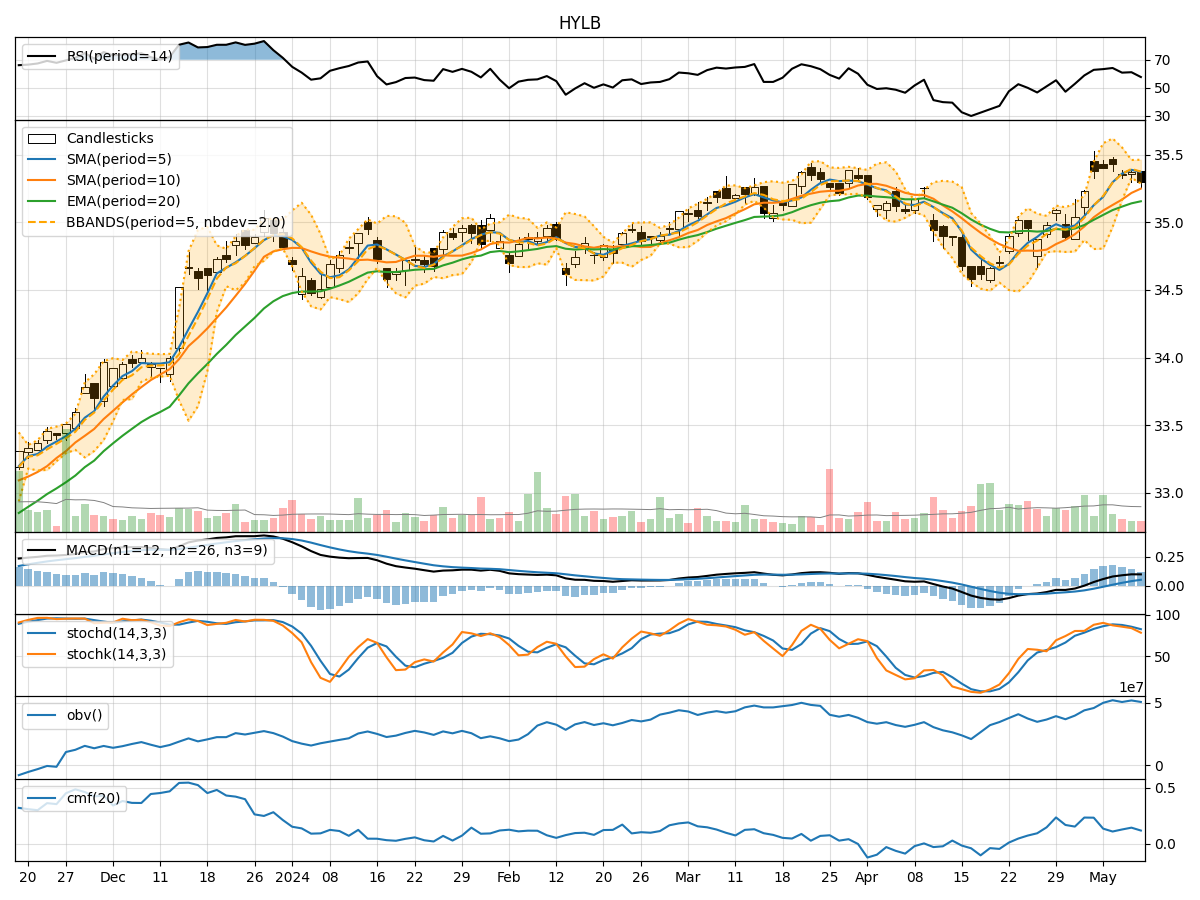
- Moving Averages (MA): The 5-day Moving Average (MA) has been showing a slight uptrend, indicating a positive momentum in the short term.
- MACD and Signal Line: The MACD has been consistently positive over the last 5 days, suggesting a bullish trend.
- Relative Strength Index (RSI): The RSI values have been fluctuating around the mid-range, indicating a neutral sentiment in terms of momentum.
Momentum Analysis:
- Stochastic Oscillator: The Stochastic Oscillator has been gradually decreasing, signaling a potential reversal in momentum.
- Williams %R (Willr): The Williams %R values have been in the oversold territory, suggesting a possible upcoming bullish reversal.
Volatility Analysis:
- Bollinger Bands (BB): The Bollinger Bands have been narrowing, indicating decreasing volatility and a potential price breakout in the near future.
Volume Analysis:
- On-Balance Volume (OBV): The OBV has been relatively stable, showing a consistent accumulation of volume.
- Chaikin Money Flow (CMF): The CMF values have been fluctuating, indicating a neutral sentiment in terms of volume flow.
Key Observations:
- The trend indicators suggest a bullish sentiment in the short term, supported by the positive MACD and MA trends.
- Momentum indicators show a potential reversal in momentum, with the Stochastic Oscillator hinting at a bearish divergence.
- Volatility indicators point towards a potential breakout, as the Bollinger Bands are contracting.
- Volume indicators reflect a neutral sentiment, with stable OBV and fluctuating CMF values.
Conclusion:
Based on the analysis of the technical indicators, the stock price of HYLB is likely to experience a short-term bullish movement in the coming days. However, caution is advised due to the potential reversal in momentum indicated by the Stochastic Oscillator. Traders should closely monitor the price action for any signs of a trend reversal or breakout.