Technical Analysis of HYLG 2024-05-10
Overview:
In analyzing the technical indicators for HYLG over the last 5 days, we will delve into the trend, momentum, volatility, and volume indicators to provide a comprehensive assessment of the stock's potential price movement. By examining these key factors, we aim to offer valuable insights and predictions for the next few days.
Trend Indicators:
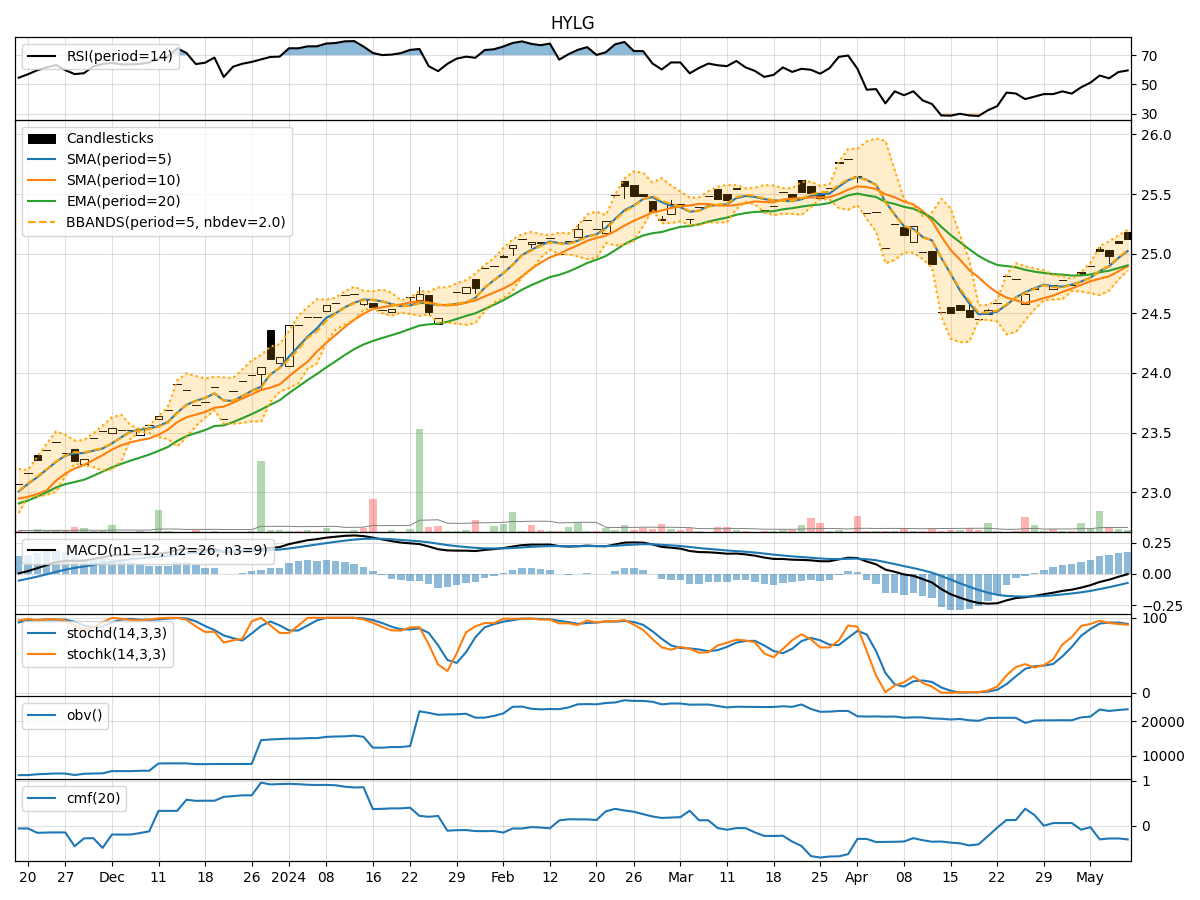
- Moving Averages (MA): The 5-day MA has been consistently above the closing price, indicating a short-term uptrend.
- MACD: The MACD line has been below the signal line, suggesting a bearish momentum.
- MACD Histogram: The histogram has been gradually decreasing, signaling a weakening bearish momentum.
Key Observation: The stock is in a short-term uptrend but with weakening bearish momentum.
Momentum Indicators:
- RSI: The RSI has been fluctuating around the 50 level, indicating a lack of strong momentum.
- Stochastic Oscillator: Both %K and %D have been declining, pointing towards a potential bearish crossover.
- Williams %R: The indicator has been hovering in the oversold territory, suggesting a possible reversal.
Key Observation: Momentum is currently neutral with a slight bearish bias.
Volatility Indicators:
- Bollinger Bands (BB): The stock price has been trading within the bands, showing no extreme volatility.
- Bollinger %B: The %B indicator has been fluctuating around the midline, indicating a balanced volatility level.
Key Observation: Volatility is relatively stable with no significant price extremes.
Volume Indicators:
- On-Balance Volume (OBV): The OBV has shown mixed signals with fluctuations in volume flow.
- Chaikin Money Flow (CMF): The CMF has been consistently negative, indicating selling pressure.
Key Observation: Volume indicators suggest a lack of strong buying interest and prevailing selling pressure.
Conclusion:
Based on the analysis of the technical indicators, the next few days' possible stock price movement for HYLG is sideways consolidation with a slight bearish bias. The trend indicators point to a short-term uptrend but with weakening bearish momentum, while momentum indicators suggest a neutral stance with a potential bearish crossover. Volatility remains stable, indicating no significant price swings, and volume indicators reflect a lack of strong buying interest.
Overall Assessment: The stock is likely to consolidate sideways in the near term, with a possibility of a slight downward movement. Traders should exercise caution and monitor key support and resistance levels for potential entry or exit points.
Remember, market conditions can change rapidly, so it's essential to stay updated with real-time data and adjust your trading strategy accordingly.