Technical Analysis of HYMB 2024-05-10
Overview:
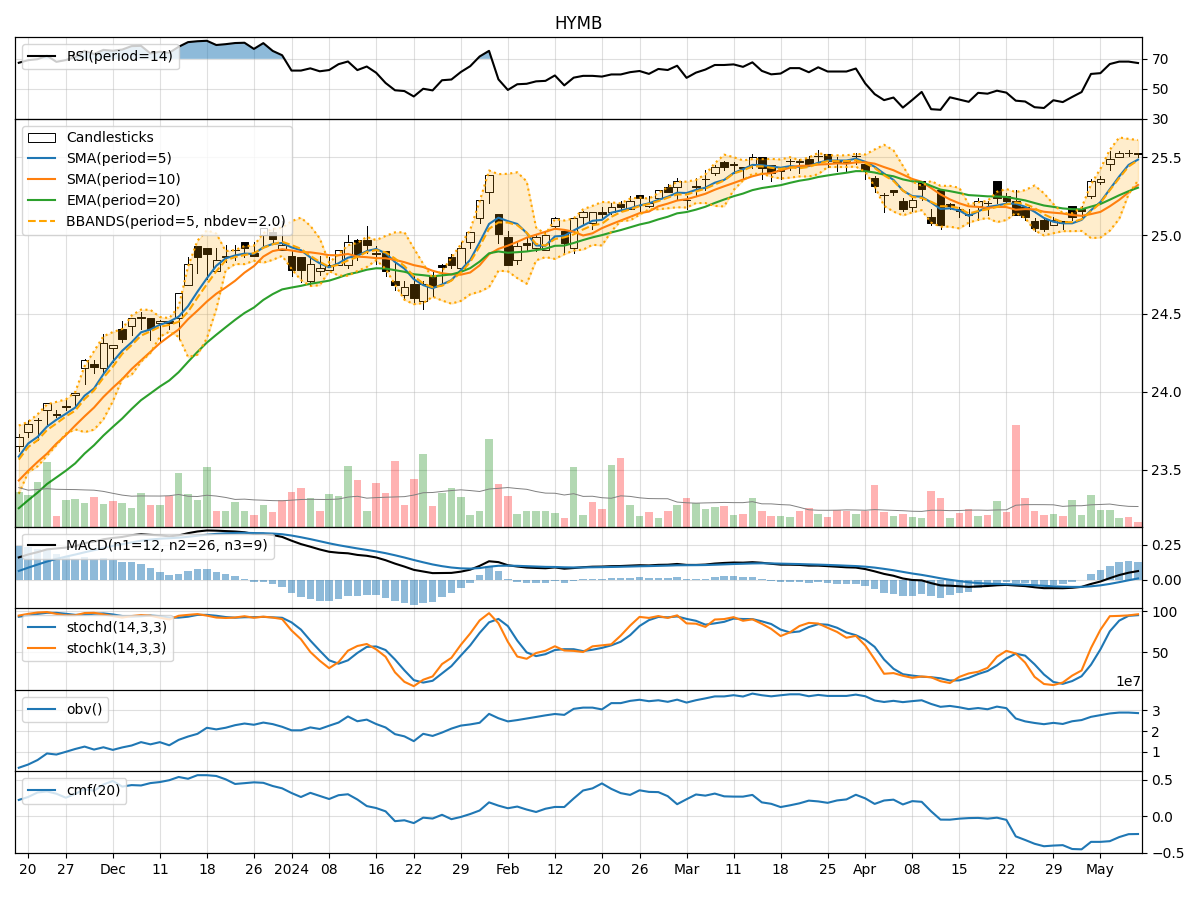
In analyzing the technical indicators for HYMB over the last 5 days, we will delve into the trend, momentum, volatility, and volume indicators to provide a comprehensive outlook on the possible stock price movement in the coming days.
Trend Analysis:
- Moving Averages (MA): The 5-day Moving Average (MA) has been consistently above the Simple Moving Average (SMA) and Exponential Moving Average (EMA), indicating a bullish trend.
- MACD: The MACD line has been consistently above the signal line, suggesting a bullish momentum.
- MACD Histogram: The MACD Histogram has been mostly positive, indicating increasing bullish momentum.
Momentum Analysis:
- RSI: The Relative Strength Index (RSI) has been in the overbought territory, suggesting a strong bullish momentum.
- Stochastic Oscillator: Both %K and %D lines of the Stochastic Oscillator have been in the overbought zone, indicating a strong bullish momentum.
- Williams %R: The Williams %R has been consistently in the oversold region, signaling a strong bullish sentiment.
Volatility Analysis:
- Bollinger Bands: The stock price has mostly remained within the Bollinger Bands, indicating moderate volatility.
- Bollinger Band Width: The Bollinger Band Width has been relatively stable, suggesting consistent volatility levels.
Volume Analysis:
- On-Balance Volume (OBV): The OBV has shown mixed signals, indicating some divergence in volume and price movements.
- Chaikin Money Flow (CMF): The CMF has been negative, suggesting a bearish sentiment in terms of volume flow.
Key Observations:
- The trend indicators suggest a strong bullish trend with positive MACD and moving averages.
- Momentum indicators indicate a highly overbought market with strong bullish sentiment.
- Volatility has been moderate, with the stock price mostly contained within the Bollinger Bands.
- Volume indicators show mixed signals with some divergence between OBV and CMF.
Conclusion:
Based on the analysis of the technical indicators, the stock is likely to continue its upward movement in the coming days. The strong bullish trend, momentum, and moderate volatility levels support this outlook. However, the mixed signals in volume indicators warrant caution, as there might be some divergence in volume and price movements. Overall, the bullish sentiment is dominant, and investors may consider maintaining or initiating long positions in HYMB.