Technical Analysis of HYMU 2024-05-10
Overview:
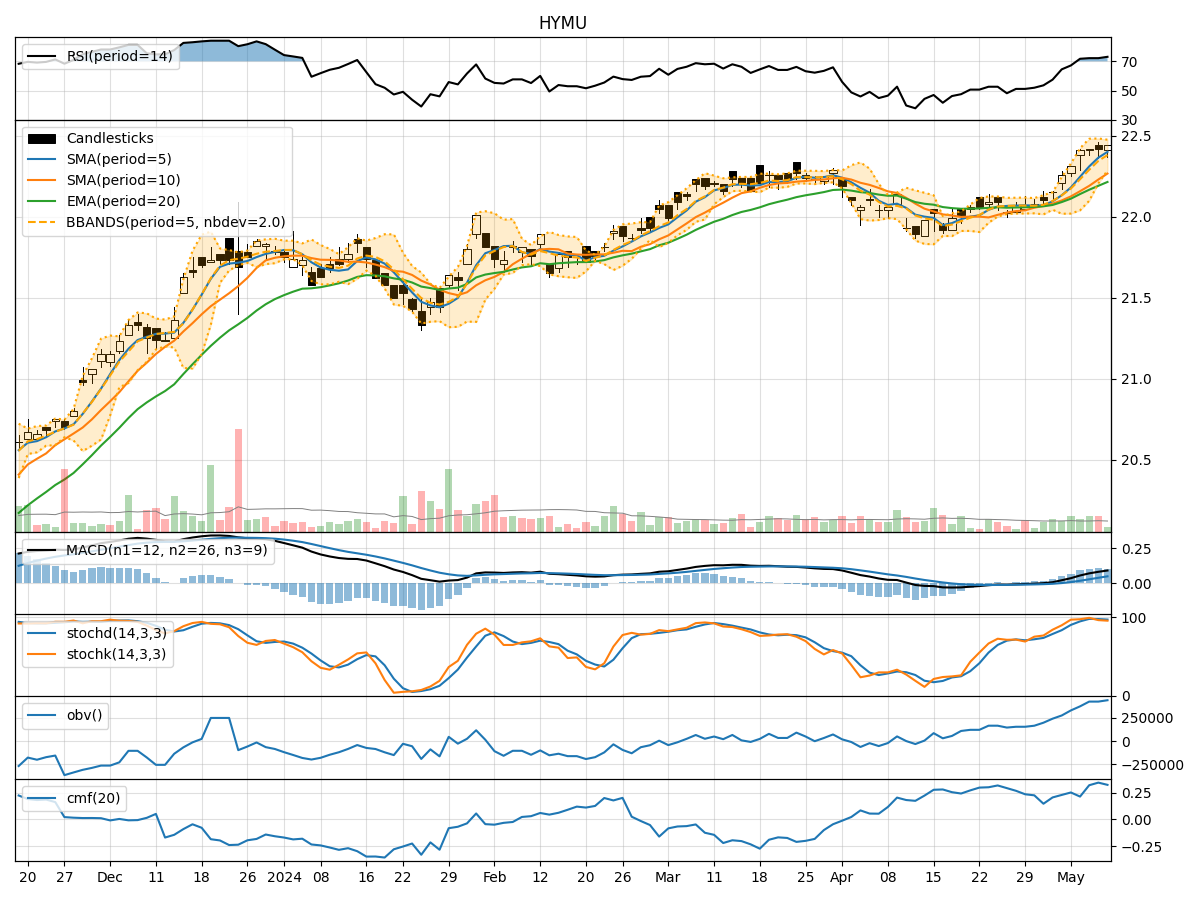
In analyzing the technical indicators for HYMU over the last 5 days, we will delve into the trend, momentum, volatility, and volume indicators to provide a comprehensive outlook on the possible stock price movement in the coming days.
Trend Indicators:
- Moving Averages (MA): The 5-day MA has been consistently above the closing prices, indicating a short-term uptrend.
- MACD: The MACD line has been above the signal line, suggesting bullish momentum.
- EMA: The EMA has been trending upwards, supporting the bullish sentiment.
Momentum Indicators:
- RSI: The RSI has been in the overbought territory, indicating strong buying momentum.
- Stochastic Oscillator: Both %K and %D have been high, signaling potential overbought conditions.
- Williams %R: The indicator has been fluctuating around the oversold region, suggesting potential buying opportunities.
Volatility Indicators:
- Bollinger Bands (BB): The stock price has been trading within the bands, indicating stable volatility.
- BB Width: The width of the bands has been narrowing, suggesting a potential decrease in volatility.
Volume Indicators:
- On-Balance Volume (OBV): The OBV has been increasing, indicating accumulation by investors.
- Chaikin Money Flow (CMF): The CMF has been positive, reflecting buying pressure in the stock.
Key Observations and Opinions:
- Trend: The trend indicators suggest a bullish sentiment with moving averages and MACD supporting an upward trajectory.
- Momentum: Momentum indicators indicate strong buying momentum, but the overbought conditions may lead to a potential pullback.
- Volatility: Volatility has been relatively stable, with a slight decrease in volatility expected based on the narrowing Bollinger Bands.
- Volume: Increasing OBV and positive CMF signal healthy accumulation and buying interest in the stock.
Conclusion:
Based on the analysis of technical indicators, the stock of HYMU is bullish in the short term. However, considering the overbought conditions in momentum indicators, there might be a potential pullback or consolidation in the coming days. Traders should closely monitor key support levels and consider taking profits on any significant price spikes.