Technical Analysis of HYXF 2024-05-10
Overview:
In analyzing the technical indicators for HYXF over the last 5 days, we will delve into the trend, momentum, volatility, and volume indicators to provide a comprehensive outlook on the possible stock price movement in the coming days. By examining these key indicators, we aim to offer valuable insights and recommendations for potential investors.
Trend Analysis:
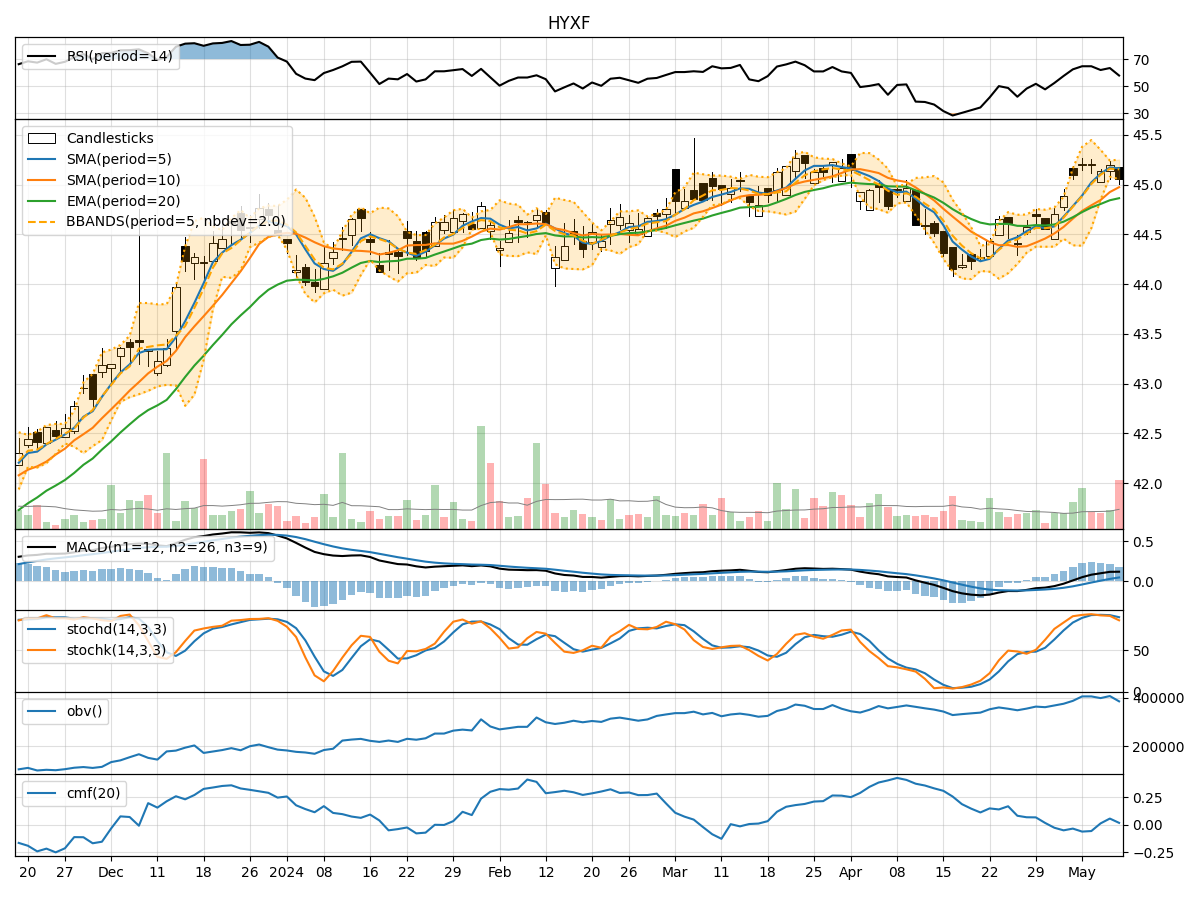
- Moving Averages (MA): The 5-day Moving Average (MA) has been consistently above the Simple Moving Average (SMA) and Exponential Moving Average (EMA), indicating a bullish trend.
- MACD: The MACD line has been consistently above the signal line, suggesting a positive momentum in the stock price.
Key Observation: The trend indicators point towards an upward trend in the stock price.
Momentum Analysis:
- RSI: The Relative Strength Index (RSI) has been fluctuating around the 60-70 range, indicating a neutral momentum.
- Stochastic Oscillator: Both %K and %D have been gradually decreasing, signaling a potential reversal in momentum.
Key Observation: The momentum indicators suggest a neutral to slightly bearish sentiment in the stock.
Volatility Analysis:
- Bollinger Bands (BB): The stock price has been trading within the Bollinger Bands, with the bands narrowing, indicating decreasing volatility.
Key Observation: Volatility indicators suggest a consolidation phase in the stock price.
Volume Analysis:
- On-Balance Volume (OBV): The OBV has shown mixed movements, indicating indecision among investors.
- Chaikin Money Flow (CMF): The CMF has been fluctuating around the zero line, reflecting a lack of strong buying or selling pressure.
Key Observation: Volume indicators suggest a lack of clear direction in investor sentiment.
Conclusion:
Based on the analysis of the technical indicators, the stock price of HYXF is likely to experience sideways movement in the coming days. While the trend indicators point towards an upward bias, the momentum indicators suggest a neutral to slightly bearish sentiment. The volatility indicators indicate a consolidation phase, and the volume indicators reflect indecision among investors.
Overall Assessment: The stock is expected to trade within a narrow range with no clear trend direction. Investors should exercise caution and wait for a clearer signal before making any significant trading decisions.