Technical Analysis of HYXU 2024-05-10
Overview:
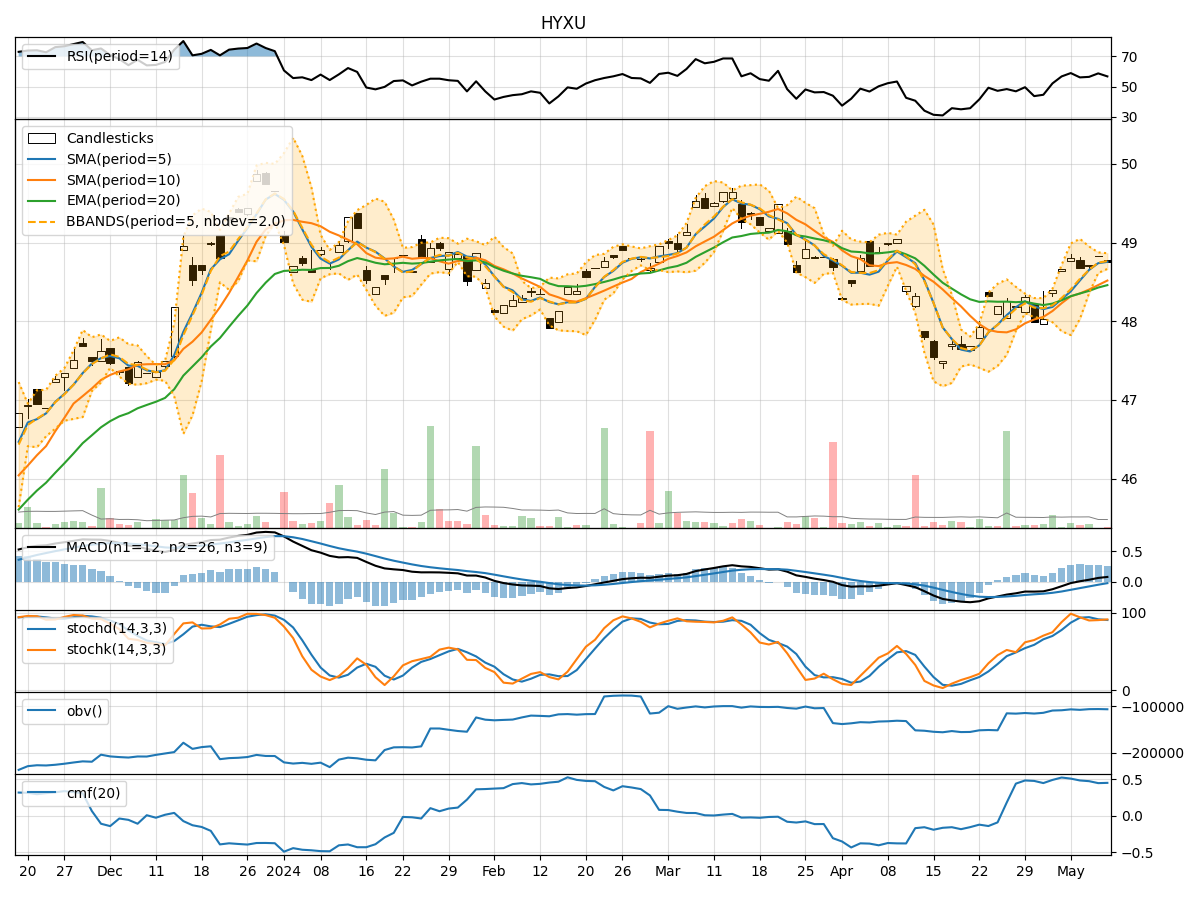
In the last 5 trading days, HYXU stock has shown a relatively stable performance with minor fluctuations in price and volume. By analyzing various technical indicators such as trend, momentum, volatility, and volume, we can gain insights into the potential future price movement of the stock.
Trend Analysis:
- Moving Averages (MA): The 5-day Moving Average (MA) has been consistently above the closing price, indicating a short-term uptrend.
- MACD: The MACD line has been positive and above the signal line, suggesting bullish momentum.
- RSI: The Relative Strength Index (RSI) has been fluctuating around the 50 level, indicating a neutral trend.
Key Observation: The trend indicators suggest a slightly bullish outlook for the stock.
Momentum Analysis:
- Stochastic Oscillator: Both %K and %D have been fluctuating in the overbought territory, indicating potential overvaluation.
- Williams %R: The Williams %R has been hovering around oversold levels, suggesting a possible reversal.
Key Observation: The momentum indicators show a mixed signal, with potential for a short-term correction.
Volatility Analysis:
- Bollinger Bands (BB): The stock price has been trading within the Bollinger Bands, indicating normal volatility.
- BB% (Bollinger Band %B): The %B has been fluctuating around the midline, suggesting a balanced market sentiment.
Key Observation: Volatility indicators point towards a sideways movement in the stock price.
Volume Analysis:
- On-Balance Volume (OBV): The OBV has shown a slight increase, indicating accumulation by investors.
- Chaikin Money Flow (CMF): The CMF has been positive, suggesting buying pressure in the stock.
Key Observation: Volume indicators signal a positive sentiment among investors.
Conclusion:
Based on the analysis of trend, momentum, volatility, and volume indicators, the next few days' possible stock price movement for HYXU is likely to be sideways with a slightly bullish bias. Investors should monitor the stock closely for any signs of a breakout or reversal in the current trend. It is advisable to exercise caution and consider implementing risk management strategies to navigate potential market fluctuations effectively.