Technical Analysis of IAK 2024-05-10
Overview:
In analyzing the technical indicators for IAK over the last 5 days, we will delve into the trend, momentum, volatility, and volume indicators to provide a comprehensive outlook on the possible stock price movement in the coming days. By examining these key aspects, we aim to offer valuable insights and predictions for informed decision-making.
Trend Indicators:
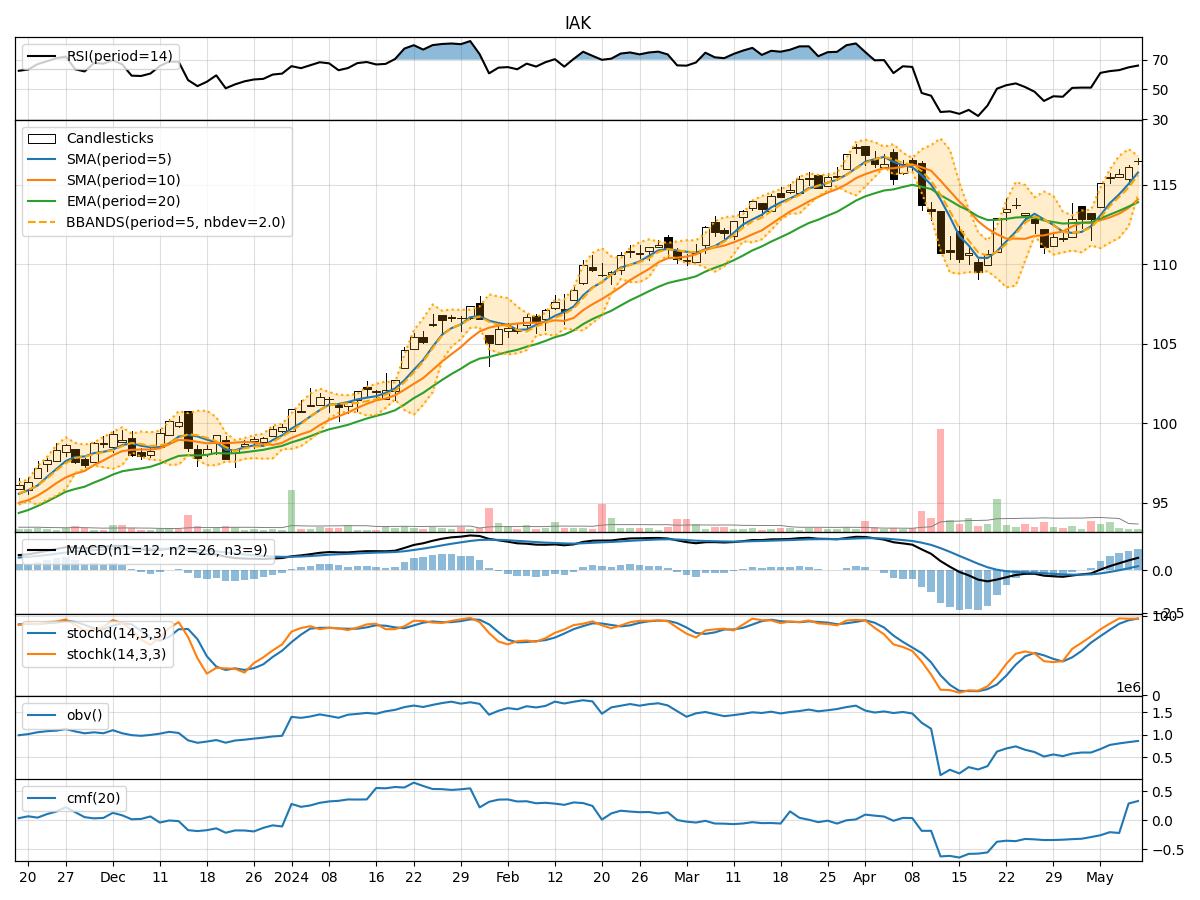
- Moving Averages (MA): The 5-day moving average has been consistently rising, indicating a bullish trend in the short term.
- MACD: The MACD line has been above the signal line, suggesting positive momentum in the stock price.
- EMA: The exponential moving average has been trending upwards, supporting the bullish sentiment.
Momentum Indicators:
- RSI: The Relative Strength Index has been increasing, showing strengthening momentum.
- Stochastic Oscillator: Both %K and %D have been in the overbought zone, indicating a potential reversal or consolidation.
- Williams %R: The indicator has been in the oversold territory, signaling a possible bullish reversal.
Volatility Indicators:
- Bollinger Bands: The bands have been narrowing, suggesting decreasing volatility and a potential breakout.
- Bollinger %B: The %B indicator has been fluctuating within a range, indicating uncertainty in price direction.
Volume Indicators:
- On-Balance Volume (OBV): The OBV has been declining, reflecting selling pressure in the stock.
- Chaikin Money Flow (CMF): The CMF has shown mixed signals, hovering around the zero line.
Key Observations and Opinions:
- Trend: The stock is in an upward trend based on moving averages and MACD.
- Momentum: Momentum indicators suggest a potential reversal due to overbought conditions.
- Volatility: Bollinger Bands indicate a potential breakout as volatility decreases.
- Volume: The declining OBV signals selling pressure, while CMF shows neutral sentiment.
Conclusion:
Based on the analysis of technical indicators, the next few days' possible stock price movement for IAK is likely to experience consolidation or a minor pullback. The bullish trend may face resistance due to overbought momentum and selling pressure indicated by volume indicators. Traders should watch for a potential breakout as volatility decreases, but caution is advised due to mixed signals in momentum and volume. Exercise patience and wait for clearer signals before making significant trading decisions.