Technical Analysis of IAPR 2024-05-10
Overview:
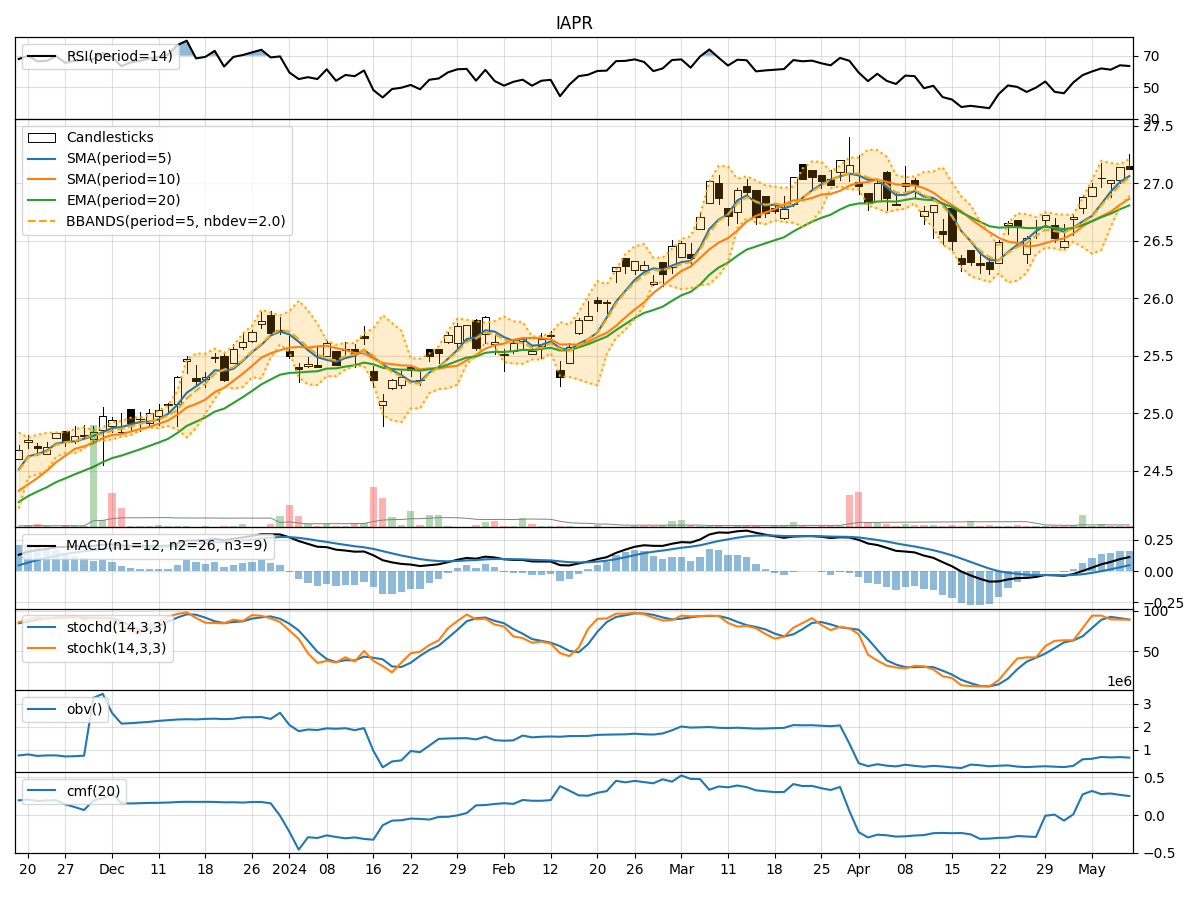
In the last 5 trading days, IAPR stock has shown a consistent upward trend in its closing price, accompanied by increasing trading volumes. The moving averages have been trending upwards, indicating a positive momentum. The MACD and RSI are also showing bullish signals. However, the stock is currently trading near its upper Bollinger Band, suggesting a potential overbought condition. Let's delve deeper into each category of technical indicators to provide a comprehensive analysis and make a prediction for the next few days.
Trend Indicators:
- Moving Averages (MA): The 5-day MA has been consistently above the 10-day SMA, indicating a short-term bullish trend. The EMA(20) is also trending upwards, supporting the bullish momentum.
- MACD: The MACD line has been above the signal line for the past 5 days, indicating a bullish trend. The MACD histogram is also showing an increasing positive value, suggesting strengthening bullish momentum.
Momentum Indicators:
- RSI: The RSI has been consistently above 50, indicating bullish momentum. However, it is important to note that the RSI is approaching overbought levels, which could signal a potential reversal or consolidation.
- Stochastic Oscillator: Both %K and %D lines are in the overbought zone, suggesting that the stock may be overvalued in the short term.
Volatility Indicators:
- Bollinger Bands: The stock price has been consistently trading near the upper Bollinger Band, indicating an overbought condition. This could potentially lead to a pullback or consolidation in the near future.
- Bollinger %B: The %B indicator is above 0.8, further confirming the overbought condition.
Volume Indicators:
- On-Balance Volume (OBV): The OBV has been showing a slight decline over the past few days, indicating some distribution happening in the stock.
- Chaikin Money Flow (CMF): The CMF(20) is positive, suggesting that money is flowing into the stock. However, the decreasing trend in OBV raises some concerns about the sustainability of this inflow.
Key Observations and Opinions:
- The stock is currently exhibiting strong bullish momentum based on the trend and momentum indicators.
- However, the overbought signals from the Stochastic Oscillator, RSI, and Bollinger Bands indicate a potential reversal or consolidation in the near future.
- The declining OBV and potential divergence with the CMF raise concerns about the sustainability of the current uptrend.
Conclusion:
Based on the analysis of the technical indicators, the stock is likely to experience a short-term pullback or consolidation in the next few days. Traders should exercise caution and consider taking profits or implementing risk management strategies. The overbought conditions suggest that the stock may need to correct before resuming its upward trend. It is advisable to wait for clearer signals or a healthy retracement before considering new long positions.