Technical Analysis of IBB 2024-05-10
Overview:
In analyzing the technical indicators for IBB over the last 5 days, we will delve into the trend, momentum, volatility, and volume indicators to provide a comprehensive outlook on the possible stock price movement in the coming days. By examining these key indicators, we aim to offer valuable insights and predictions for informed decision-making.
Trend Indicators:
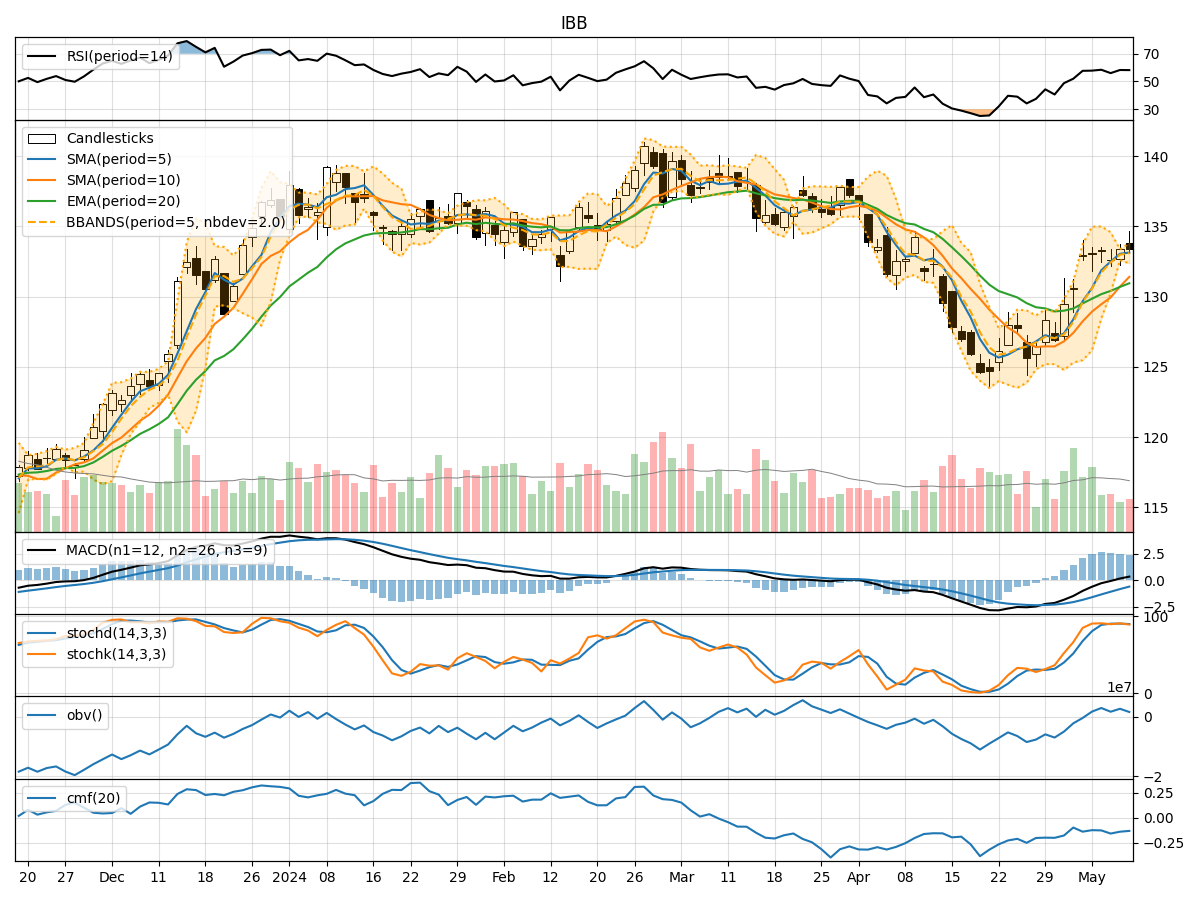
- Moving Averages (MA): The 5-day moving average has been consistently above the longer-term SMAs and EMAs, indicating a short-term uptrend.
- MACD: The MACD line has been positive, suggesting bullish momentum in the stock price.
- MACD Histogram: The MACD histogram has been increasing, indicating strengthening bullish momentum.
Momentum Indicators:
- RSI: The RSI has been in the neutral zone around 50-60, suggesting neither overbought nor oversold conditions.
- Stochastic Oscillator: The stochastic indicators have been fluctuating around the overbought territory, indicating potential for a reversal.
- Williams %R: The Williams %R has been hovering around the oversold region, signaling a possible buying opportunity.
Volatility Indicators:
- Bollinger Bands: The stock price has been trading within the Bollinger Bands, indicating a period of consolidation.
- Bollinger %B: The %B indicator has been fluctuating around the midline, suggesting a balanced market sentiment.
Volume Indicators:
- On-Balance Volume (OBV): The OBV has been relatively stable, indicating no significant divergence between price and volume.
- Chaikin Money Flow (CMF): The CMF has been negative, reflecting selling pressure in the stock.
Key Observations and Opinions:
- Trend: The trend indicators suggest a short-term uptrend in the stock price.
- Momentum: Momentum indicators show mixed signals, with potential for a reversal in the overbought territory.
- Volatility: Volatility indicators point towards a period of consolidation.
- Volume: Volume indicators indicate a lack of significant divergence between price and volume.
Conclusion:
Based on the analysis of the technical indicators, the stock price of IBB is likely to experience sideways movement in the coming days. The trend is bullish in the short term, but momentum indicators suggest a possible reversal. Volatility is low, indicating consolidation, while volume indicators show a lack of significant buying or selling pressure. Traders should exercise caution and closely monitor key support and resistance levels for potential entry or exit points.