Technical Analysis of IBD 2024-05-10
Overview:
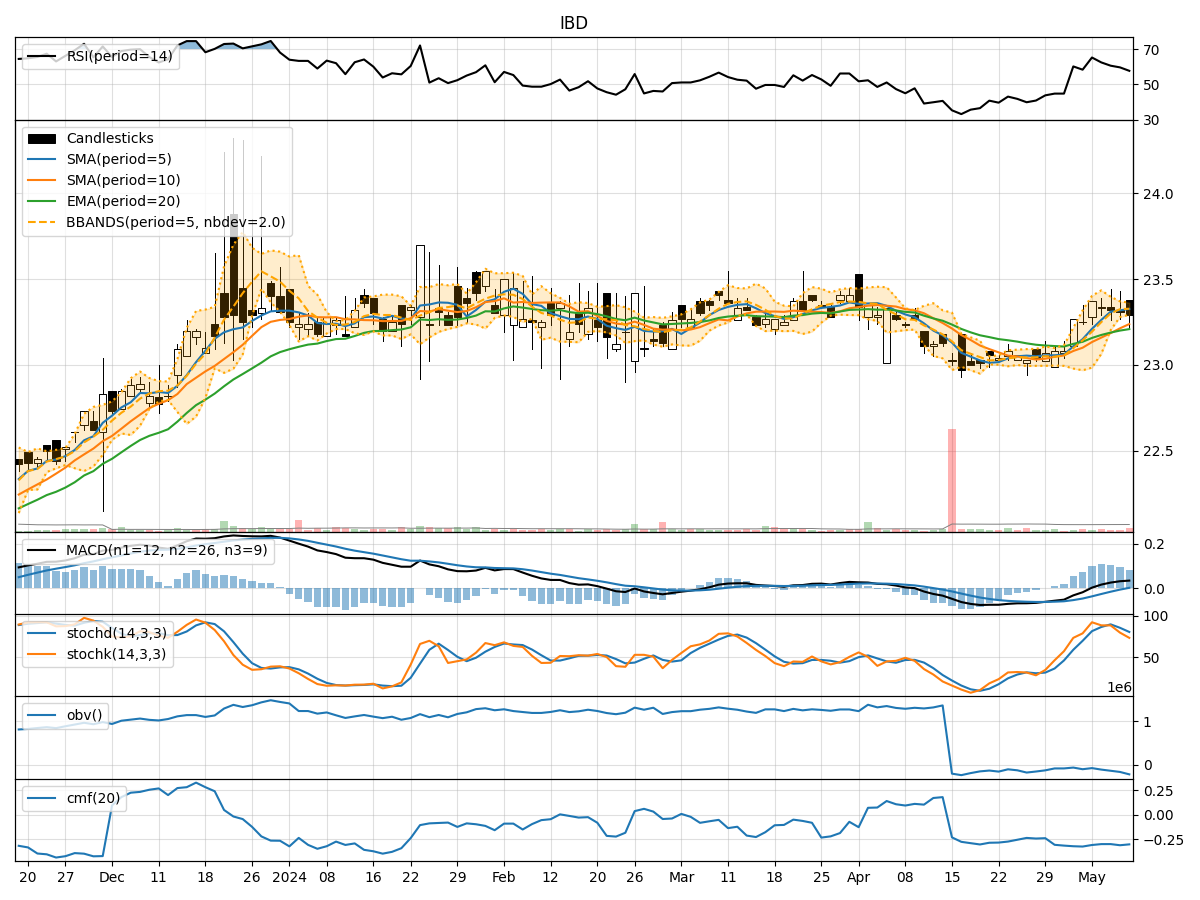
In the last 5 trading days, the stock has shown a relatively stable price movement with a slight downward trend. The technical indicators provide insights into the trend, momentum, volatility, and volume of the stock. By analyzing these indicators, we can make informed predictions about the possible future price movement of the stock.
Trend Analysis:
- Moving Averages (MA): The 5-day Moving Average (MA) has been slightly increasing, indicating a short-term uptrend. However, the Simple Moving Average (SMA) and Exponential Moving Average (EMA) show a relatively flat trend.
- MACD: The MACD line has been consistently positive, but the MACD Histogram has been decreasing, suggesting a weakening bullish momentum.
Momentum Analysis:
- RSI: The Relative Strength Index (RSI) has been gradually decreasing, indicating a loss in bullish momentum.
- Stochastic Oscillator: Both %K and %D of the Stochastic Oscillator have been declining, signaling a potential bearish momentum shift.
- Williams %R: The Williams %R is in the oversold territory, suggesting a possible reversal in the short term.
Volatility Analysis:
- Bollinger Bands (BB): The Bollinger Bands have been narrowing, indicating decreasing volatility in the stock price.
- Bollinger %B: The %B indicator is hovering around the middle, suggesting a neutral stance in terms of volatility.
Volume Analysis:
- On-Balance Volume (OBV): The OBV has been consistently decreasing, indicating a potential distribution phase.
- Chaikin Money Flow (CMF): The CMF has been negative, reflecting selling pressure in the stock.
Conclusion:
Based on the analysis of the technical indicators: - The stock is currently in a consolidation phase with a slight downward bias. - The weakening momentum and decreasing volume suggest a possible bearish outlook in the short term. - The narrowing Bollinger Bands and negative CMF further support the bearish sentiment. - Traders should exercise caution and consider short-term selling opportunities or wait for a clearer trend confirmation before entering new positions.
Key Takeaways:
- Bearish Bias: The stock is likely to experience further downward pressure in the coming days.
- Consolidation Phase: Expect the stock to trade within a range with limited upside potential.
- Short-Term Selling: Consider short-term selling strategies or wait for a clearer trend signal before making new investments.
In conclusion, the technical analysis suggests a bearish outlook for the stock in the near future. It is essential for traders to monitor the indicators closely for any potential trend reversals or significant developments that could impact the stock price movement.