Technical Analysis of IBDQ 2024-05-10
Overview:
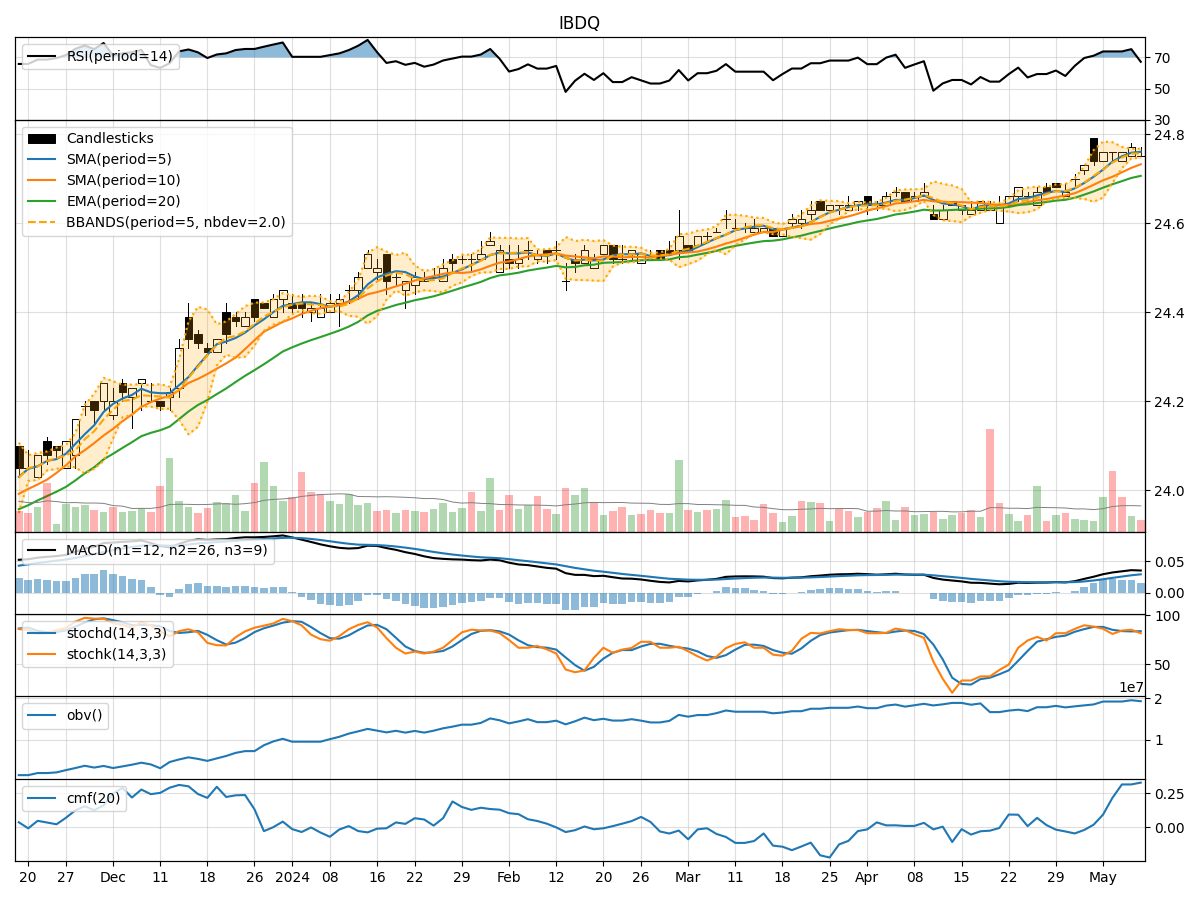
In the last 5 trading days, the stock price of IBDQ has been relatively stable around the $24.75 mark. Various technical indicators have been analyzed to provide insights into the potential future price movement of the stock. The analysis covers trend indicators, momentum indicators, volatility indicators, and volume indicators to form a comprehensive view of the stock's potential direction.
Trend Indicators:
- Moving Averages (MA): The 5-day MA has been consistently above the closing price, indicating a short-term bullish trend.
- MACD: The MACD line has been positive and increasing, suggesting upward momentum.
- RSI: The RSI has been relatively high, indicating overbought conditions.
Key Observation: The trend indicators suggest a bullish sentiment in the short term.
Momentum Indicators:
- RSI: The RSI has been high, indicating potential overbought conditions.
- Stochastic Oscillator: Both %K and %D have been relatively high, suggesting a strong upward momentum.
- Williams %R: The indicator has been in the oversold territory, indicating a potential reversal.
Key Observation: Momentum indicators show conflicting signals, with RSI indicating overbought conditions while Stochastic Oscillator and Williams %R suggest further upside potential.
Volatility Indicators:
- Bollinger Bands: The stock price has been trading within the bands, indicating stable volatility.
- Bollinger %B: The %B indicator has been fluctuating around the midline, suggesting no extreme conditions.
Key Observation: Volatility indicators point towards a stable price movement with no significant deviations.
Volume Indicators:
- On-Balance Volume (OBV): The OBV has been relatively flat, indicating no significant accumulation or distribution.
- Chaikin Money Flow (CMF): The CMF has been positive, suggesting buying pressure in the stock.
Key Observation: Volume indicators show a lack of significant volume changes, with a slight bias towards buying pressure.
Conclusion:
Based on the analysis of the technical indicators, the next few days' possible stock price movement for IBDQ is likely to continue in an upward direction. The trend indicators suggest a bullish sentiment, supported by positive momentum indicators despite some overbought conditions. Volatility indicators indicate stability, and volume indicators show a slight bias towards buying pressure.
Overall, the stock is poised for further upside potential in the short term. Investors may consider maintaining or initiating long positions in IBDQ based on the technical analysis provided.