Technical Analysis of IBDR 2024-05-10
Overview:
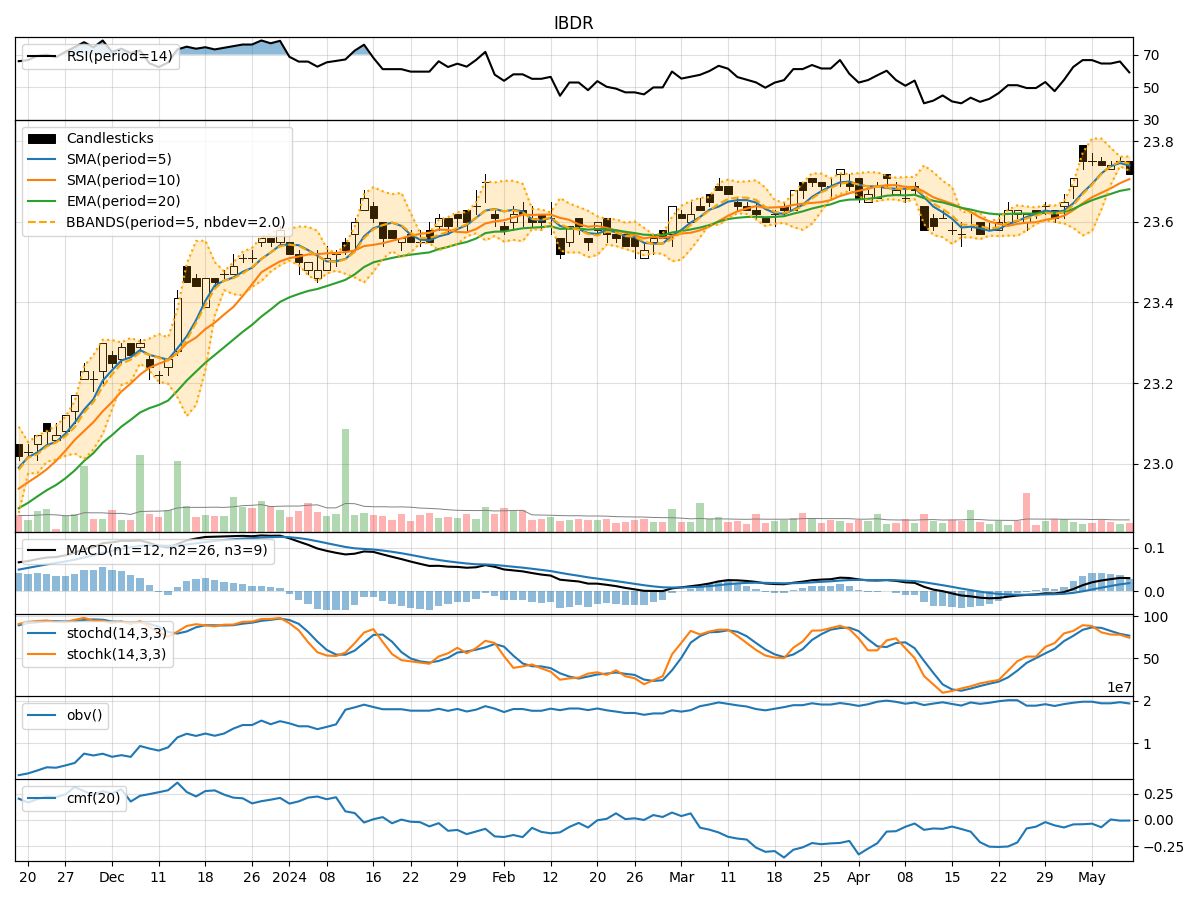
In the last 5 trading days, IBDR stock has shown relatively stable price movements with minor fluctuations. The technical indicators across trend, momentum, volatility, and volume categories provide insights into the stock's potential future price movements. Let's analyze each category in detail to determine the possible next few days' stock price movement.
Trend Analysis:
- Moving Averages (MA): The 5-day MA has been consistently close to the actual closing prices, indicating a stable trend.
- MACD: The MACD line has been consistently positive, indicating a bullish trend.
- RSI: The RSI values have been fluctuating around the 50 level, suggesting a neutral trend.
Key Observation: The trend indicators suggest a slightly bullish sentiment in the short term.
Momentum Analysis:
- Stochastic Oscillator: Both %K and %D values have been decreasing, indicating a potential reversal in momentum.
- Williams %R: The Williams %R values have been fluctuating in the oversold territory, suggesting a possible reversal.
Key Observation: Momentum indicators show a potential shift towards a bearish momentum in the near future.
Volatility Analysis:
- Bollinger Bands: The stock price has been trading within the bands, indicating stable volatility.
- Bollinger %B: The %B values have been fluctuating around the midline, suggesting neutral volatility.
Key Observation: Volatility indicators point towards a stable price movement with no significant volatility expected.
Volume Analysis:
- On-Balance Volume (OBV): The OBV values have been fluctuating, indicating indecision among investors.
- Chaikin Money Flow (CMF): The CMF values have been close to zero, suggesting a lack of strong buying or selling pressure.
Key Observation: Volume indicators reflect a neutral sentiment with no clear direction in trading volume.
Conclusion:
- Overall Assessment: Based on the technical indicators analyzed, the stock is likely to experience sideways consolidation in the next few days.
- Key Conclusion: The stock is expected to trade within a narrow range without any significant upward or downward movement.
Recommendation: It is advisable for investors to exercise caution and closely monitor the price action for any potential breakout or trend reversal signals before making trading decisions.
In conclusion, the technical analysis suggests a sideways consolidation pattern for IBDR stock in the upcoming days, with no clear trend direction indicated by the indicators.