Technical Analysis of IBDT 2024-05-10
Overview:
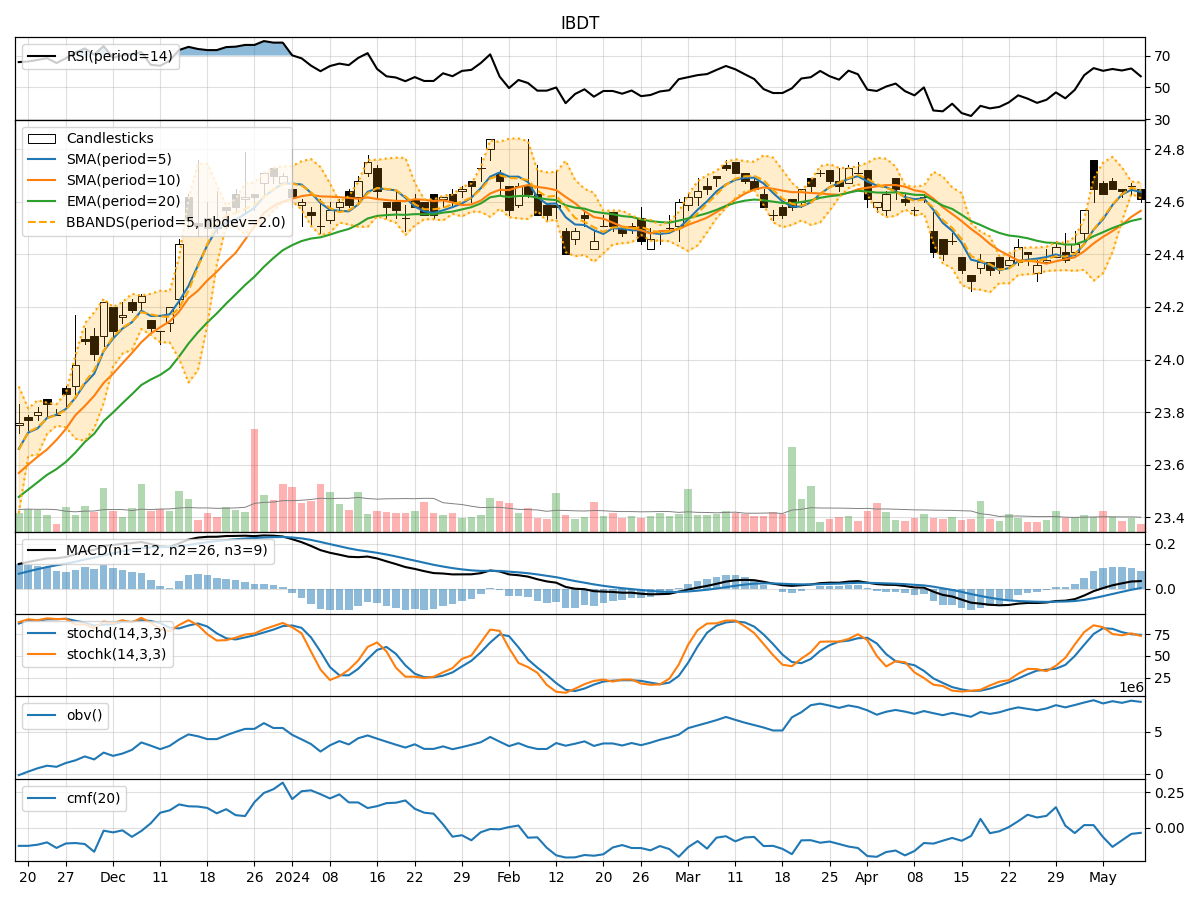
In analyzing the technical indicators for IBDT over the last 5 days, we will delve into the trends, momentum, volatility, and volume aspects to provide a comprehensive outlook on the possible stock price movement. By examining key indicators such as moving averages, MACD, RSI, Bollinger Bands, and OBV, we aim to offer valuable insights and predictions for the upcoming days.
Trend Analysis:
- Moving Averages (MA): The 5-day MA has been consistently above the closing price, indicating a short-term uptrend.
- MACD: The MACD line has been above the signal line, suggesting bullish momentum.
- EMA: The EMA has been trending upwards, supporting the bullish sentiment.
Key Observation: The trend indicators point towards an upward trajectory for IBDT.
Momentum Analysis:
- RSI: The RSI has been fluctuating around the overbought territory, indicating strong buying pressure.
- Stochastic Oscillator: Both %K and %D have been relatively high, signaling bullish momentum.
- Williams %R: The indicator has been in the oversold region, potentially hinting at a reversal.
Key Observation: Momentum indicators suggest a bullish sentiment for IBDT.
Volatility Analysis:
- Bollinger Bands: The stock price has mostly stayed within the bands, showing moderate volatility.
- Bollinger %B: The %B indicator has been fluctuating within a reasonable range, indicating stability.
Key Observation: Volatility indicators imply a sideways movement or consolidation phase for IBDT.
Volume Analysis:
- On-Balance Volume (OBV): The OBV has been fluctuating but generally maintaining a neutral stance.
- Chaikin Money Flow (CMF): The CMF has been negative, suggesting some selling pressure.
Key Observation: Volume indicators reflect a neutral sentiment with a slight inclination towards selling pressure.
Conclusion:
Based on the comprehensive analysis of trend, momentum, volatility, and volume indicators, the overall outlook for IBDT in the next few days appears to be bullish with a potential for upward movement. The strong trend and momentum signals, coupled with stable volatility, indicate a favorable environment for price appreciation. However, it is essential to monitor volume closely as any significant increase in selling pressure could impact the bullish outlook. Traders and investors should consider entering long positions with appropriate risk management strategies in place.
In conclusion, the technical analysis suggests a bullish outlook for IBDT in the upcoming days, with potential for upward price movement.