Technical Analysis of IBDU 2024-05-10
Overview:
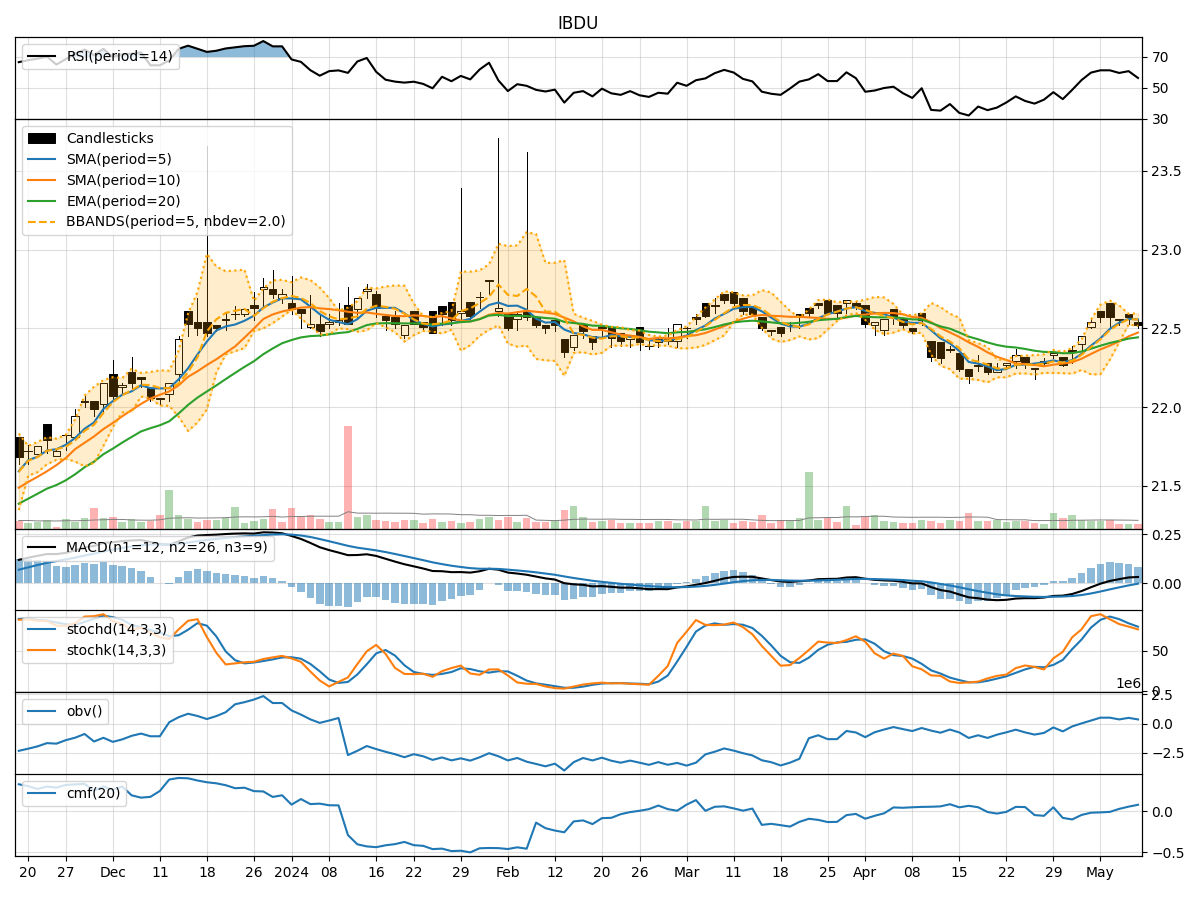
In analyzing the technical indicators for the stock represented by the IBDU ticker symbol over the last 5 days, we will delve into the trend, momentum, volatility, and volume indicators to provide a comprehensive outlook on the possible future stock price movement. By examining these key aspects, we aim to offer valuable insights and predictions for potential investors.
Trend Analysis:
- Moving Averages (MA): The 5-day Moving Average (MA) has been relatively stable around the closing prices, indicating a consistent trend.
- MACD and Signal Line: The MACD line has shown a slight positive trend, with the MACD line crossing above the signal line, suggesting a potential bullish momentum.
- Relative Strength Index (RSI): The RSI has been fluctuating around the 60-65 range, indicating a moderate level of buying pressure.
Momentum Analysis:
- Stochastic Oscillator: The Stochastic Oscillator has been gradually decreasing but remains in the overbought territory, suggesting a potential reversal or consolidation.
- Williams %R (Willr): The Williams %R indicator has been in the oversold region, indicating a possible buying opportunity.
Volatility Analysis:
- Bollinger Bands (BB): The Bollinger Bands have been relatively narrow, indicating low volatility in the stock price.
Volume Analysis:
- On-Balance Volume (OBV): The OBV has shown mixed signals, with fluctuations in volume accumulation.
- Chaikin Money Flow (CMF): The CMF has been slightly positive, indicating some buying pressure.
Key Observations:
- The stock has been trading within a narrow range with stable moving averages and low volatility.
- Momentum indicators suggest a potential reversal or consolidation in the near term.
- Volume indicators show mixed signals, reflecting uncertainty in market participation.
Conclusion:
Based on the analysis of the technical indicators, the stock is likely to experience sideways consolidation in the next few days. The stable moving averages, low volatility, and mixed momentum and volume signals indicate a lack of clear direction in the short term. Investors should exercise caution and wait for clearer signals before making significant trading decisions.